
Federal leaders’ debates: How Canadians responded to the 2021 debates and what they want for future debates
- John R. McAndrews (University of Toronto)
- Aengus Bridgman (McGill University)
- Peter John Loewen (University of Toronto)
- Thomas Bergeron (University of Toronto)
- Thomas Galipeau (University of Toronto)
- Allison Harell (Université du Québec à Montréal)
- Daniel Rubenson (Ryerson University)
- Laura B. Stephenson (Western University)
January 5, 2022
Table of Contents
- 1 Introduction
- 2 Summary of findings
- 3 Methodology
- 4 Findings
- 5 Comparing the 2019 and 2021 findings
- Appendix - Supplementary Report on Focus Groups
1 Introduction
We were engaged by the Leaders' Debates Commission to conduct a comprehensive examination of the public's response to federal leaders' debates. Our aim was two-fold: first, to investigate how the public evaluated and reacted to the two Commission-organized leaders' debates held during the 2021 federal election campaign; and, second, to explore the public's preferences for how such debates should be conducted in future. We did so by conducting and analyzing three broadly representative online surveys of Canadians and by collecting and analyzing approximately 12 million tweets from before, during, and after the 2021 election.
Our report serves as both a companion to—and an extension of—our 2019 report to the Commission. As in 2019, we report here on the public's awareness, viewership, discussion, and evaluation of the leaders' debates. Like our 2019 report, we also leverage a panel survey design to estimate the impacts that the debates had on citizens' political engagement, knowledge, judgements, and behaviour. We then build on our work by diving deeper into the public's preferences for how debates should be conducted—examining what citizens think should be the goals of such debates, who should participate in the debates, how the debates should be moderated, what formats should be used, and when the debates should be scheduled. The result is—we believe—the most comprehensive and up-to-date portrait available of what Canadians want for their federal leaders' debates.
2 Summary of findings
We find that the 2021 debates attracted a significant public audience, though somewhat smaller than in 2019. Majorities of both French debate viewers and English debate viewers agreed that the debates were informative—reserving their most favourable evaluations for how each debate was moderated. We also find that the debates generated several positive outcomes. They contributed, for example, to increases in citizens' political interest, consumption of news about the federal election, and trust in the federal government.
Looking to the future, we find that Canadians—within the context of a single-debate framework—tend to prefer a multi-topic debate that provides for both wide and equal leader participation and an assertive role for the moderator. Having said this, we also find that the public has an appetite for more than one debate in each official language. This possibility of multiple debates also gives rise to public interest in other, more specialized forms of campaign-based public events outside the recent norm—such as public meetings between leaders and citizens, issue-specific debates, and regionally-focused debates.
3 Methodology
3.1 Survey research
We conducted three online surveys of Canadians. The first wave was conducted between September 2 and September 8—ending just before the start of the French debate at 8 pm Eastern on that day. This first wave sample was constructed from online panels using quotas for region (Atlantic, Quebec, Ontario, and the West), official language, gender, and age (18-34 years, 35-54 years, and 55+ years)—as well as flex quotas for gender and age within region.
By design, the second wave was a recontact of participants who completed the first wave. The sampling for this second wave was done in a convenience framework from among these first wave participants—along with a quota for official language. As described in Section 3.1.1, the purpose of this recontact design was to help identify within-individual change in key political attitudes and behaviours between the period just before and just after the debates.
The second wave was fielded between 10:35 pm Eastern on September 8—just after the French debate ended—through to September 16. The fielding proceeded in two stages. The first stage took place during the 24-hour interval between the end of the French debate on September 8 and the beginning of the English debate on September 9. During this first stage, the survey asked only about the French debate (since the English debate had not yet happened) and only French-speaking participants from the first wave were invited to complete it. A total of 97 French-speaking participants completed during this initial stage. The second stage of fielding began just after the end of the English debate at 11 pm Eastern on September 9. In this second stage, the battery of English debate questions was added and the survey went live to English-speaking recontacts from the first wave.
The third and final survey wave as a fresh cross-section of Canadians. It was constructed from online panels using the same quota-based sampling procedure employed in the first wave. The chief purpose of this third wave was to provide a detailed snapshot of Canadians' preferences for future debates. It was conducted between November 24 and 29.
To further promote the representativeness of these three online samples, we created survey weights for each survey wave. In the case of each wave, the sample was weighted using an iterative proportional fitting algorithm based on national population estimates for province (region, in the case of the third wave), age category, gender, 2019 voter turnout (2021 turnout, in the case of the third wave), and whether or not the participant was born in Canada.Footnote 1 Note, however, that we report unweighted results for those questions that were administered only to debate viewers (e.g., their evaluations of specific aspects of the debate) because there are understandably no population-level parameters for the demographic composition of debate viewers.
Following standard response quality checks and weighting, the total sample sizes of Waves 1, 2, and 3 were N=2002, N=995, and N=488, respectively.
3.1.1 Using within-participant change to estimate the impact of debate viewership
As noted above, the aim of recontacting Wave 1 participants in Wave 2 was to be able to administer an identical set of questions to the same individuals. In so doing, we can compare their responses from just before the debates to their responses just after the debates. This allows us to estimate the impact of the debates, which we report in Section 4.6.
We use a regression framework to estimate the impact of the debates by regressing the within-individual change in each outcome of interest on a binary indicator that takes a value of 1 if the participant watched either the French or English Commission-organized debates and 0 otherwise. We also include in the model additional covariates for gender, age in years, a 3-category measure of education, and income. In this framework, the regression estimate of the impact of debate watching captures the difference in the between-wave change in the outcome of interest between those who watched a debate and those who did not.
In Section 4.6, we report the results of this regression analysis for 26 different democratic outcomes, ranging from political interest to knowledge to vote choice. The manner in which the within-individual change was operationalized varied by outcome and is detailed in Table 1. All regression models were estimated using ordinary least squares.
| Figure Number | Name of outcome (DV) | How the outcome was operationalized |
|---|---|---|
| 23 | Change in interest about federal election | Participants were coded as: -1 if they moved from above the Wave 1 median value to at or below the Wave 1 median value; 0 if they remained at or below the Wave 1 median value or remained above the Wave 1 median value; 1 if they moved from at or below the Wave 1 median value to above the Wave 1 median value. The Wave 1 median value was 7 on a 0 to 10 scale. |
| Change in issue mentions | Participants were coded as: -1 if they moved from above the Wave 1 median value to at or below the Wave 1 median value; 0 if they remained at or below the Wave 1 median value or remained above the Wave 1 median value; 1 if they moved from at or below the Wave 1 median value to above the Wave 1 median value. The Wave 1 median value was 3 on a 0 to 6 scale. |
|
| Change in news consumption about federal election | Participants were coded as: -1 if they moved from above the Wave 1 median value to at or below the Wave 1 median value; 0 if they remained at or below the Wave 1 median value or remained above the Wave 1 median value; 1 if they moved from at or below the Wave 1 median value to above the Wave 1 median value. The Wave 1 median value was 1 on a 0 to 4 scale. |
|
| Change in discussion of federal election | Participants were coded as: -1 if they moved from above the Wave 1 median value to at or below the Wave 1 median value; 0 if they remained at or below the Wave 1 median value or remained above the Wave 1 median value; 1 if they moved from at or below the Wave 1 median value to above the Wave 1 median value. The Wave 1 median value was 0 on a 0 to 3 scale. |
|
| Change in interest about politics generally | Participants were coded as: -1 if they moved from above the Wave 1 median value to at or below the Wave 1 median value; 0 if they remained at or below the Wave 1 median value or remained above the Wave 1 median value; 1 if they moved from at or below the Wave 1 median value to above the Wave 1 median value. The Wave 1 median value was 7 on a 0 to 10 scale. |
|
| Change in news consumption in general | Participants were coded as: -1 if they moved from above the Wave 1 median value to at or below the Wave 1 median value; 0 if they remained at or below the Wave 1 median value or remained above the Wave 1 median value; 1 if they moved from at or below the Wave 1 median value to above the Wave 1 median value. The Wave 1 median value was 3 on a 1 to 6 scale. |
|
| 24 | Change in knowledge of party promises | Participants were coded as: -1 if they moved from above the Wave 1 median value to at or below the Wave 1 median value; 0 if they remained at or below the Wave 1 median value or remained above the Wave 1 median value; 1 if they moved from at or below the Wave 1 median value to above the Wave 1 median value. The Wave 1 median value was 2 on a 0 to 10 scale. |
| Change in knowledge of current economic and social conditions | Participants were coded as: -1 if they moved from above the Wave 1 median value to at or below the Wave 1 median value; 0 if they remained at or below the Wave 1 median value or remained above the Wave 1 median value; 1 if they moved from at or below the Wave 1 median value to above the Wave 1 median value. The Wave 1 median value was 1 on a 0 to 4 scale. |
|
| Chance in confidence to make a good voting decision | Participants were coded as: -1 if they moved from above the Wave 1 median value to at or below the Wave 1 median value; 0 if they remained at or below the Wave 1 median value or remained above the Wave 1 median value; 1 if they moved from at or below the Wave 1 median value to above the Wave 1 median value. The Wave 1 median value was 7 on a 0 to 10 scale. |
|
| 25 | Change in ability to evaluate party leaders' traits | Participants were coded as: -1 if they moved from above the Wave 1 median value to at or below the Wave 1 median value; 0 if they remained at or below the Wave 1 median value or remained above the Wave 1 median value; 1 if they moved from at or below the Wave 1 median value to above the Wave 1 median value. The Wave 1 median value was 15 on a 0 to 20 scale. |
| Change in ability to rate all five leaders | Participants were coded as: -1 if they rated all five party leaders in Wave 1 but did not rate all five party leaders in Wave 2; 0 if they did not rate all five party leaders in both Wave 1 and 2, or if they rated all five party leaders in both Wave 1 and 2; 1 if they did not rate all five party leaders in Wave 1 but did rate all five party leaders in Wave 2. |
|
| Change in ability to rate all five parties | Participants were coded as: -1 if they rated all five parties in Wave 1 but did not rate all five parties in Wave 2; 0 if they did not rate all five parties in both Wave 1 and 2, or if they rated all five parties in both Wave 1 and 2; 1 if they did not rate all five parties in Wave 1 but did rate all five parties in Wave 2. |
|
| Change in ability to place all five parties on left-right scale | Participants were coded as: -1 if they placed all five parties in Wave 1 but did not place all five parties in Wave 2; 0 if they did not place all five parties in both Wave 1 and 2, or if they placed all five parties in both Wave 1 and 2; 1 if they did not place all five parties in Wave 1 but did place all five parties in Wave 2. |
|
| 26 | Change in leader ratings | For each participant, we first computed the absolute difference for each of their leader feeling thermometer ratings between Wave 1 and 2, and then we computed the average of these absolute differences. The original leader ratings were on a 0 to 100 scale. |
| Change in party ratings | For each participant, we first computed the absolute difference for each of their party feeling thermometer ratings between Wave 1 and 2, and then we computed the average of these absolute differences. The original party ratings were on a 0 to 100 scale. |
|
| Change in left-right placement | For each participant, we first computed the absolute difference for each of their party left-right placements between Wave 1 and 2, and then we computed the average of these absolute differences. The original left-right part placement scale ran from 0 to 10. |
|
| Change in best party to handle the most important issue | Participants were coded as: 0 if their answer in Wave 1 was the same as their answer in Wave 2; 1 if their answer in Wave 1 differed from their answer in Wave 2. |
|
| 27 | Change in political efficacy | Participants were coded as: -1 if they moved from above the Wave 1 median value to at or below the Wave 1 median value; 0 if they remained at or below the Wave 1 median value or remained above the Wave 1 median value; 1 if they moved from at or below the Wave 1 median value to above the Wave 1 median value. The Wave 1 median value was 1 on a 0 to 3 scale. |
| Change in satisfaction with Canadian democracy | Participants were coded as: -1 if they moved from above the Wave 1 median value to at or below the Wave 1 median value; 0 if they remained at or below the Wave 1 median value or remained above the Wave 1 median value; 1 if they moved from at or below the Wave 1 median value to above the Wave 1 median value. The Wave 1 median value was 2 on a 0 to 3 scale. |
|
| Change in trust in the courts | Participants were coded as: -1 if they moved from above the Wave 1 median value to at or below the Wave 1 median value; 0 if they remained at or below the Wave 1 median value or remained above the Wave 1 median value; 1 if they moved from at or below the Wave 1 median value to above the Wave 1 median value. The Wave 1 median value was 4 on a 1 to 5 scale. |
|
| Change in trust in the federal government | Participants were coded as: -1 if they moved from above the Wave 1 median value to at or below the Wave 1 median value; 0 if they remained at or below the Wave 1 median value or remained above the Wave 1 median value; 1 if they moved from at or below the Wave 1 median value to above the Wave 1 median value. The Wave 1 median value was 3 on a 1 to 5 scale. |
|
| Change in trust in the media | Participants were coded as: -1 if they moved from above the Wave 1 median value to at or below the Wave 1 median value; 0 if they remained at or below the Wave 1 median value or remained above the Wave 1 median value; 1 if they moved from at or below the Wave 1 median value to above the Wave 1 median value. The Wave 1 median value was 3 on a 1 to 5 scale. |
|
| Change in trust in political parties | Participants were coded as: -1 if they moved from above the Wave 1 median value to at or below the Wave 1 median value; 0 if they remained at or below the Wave 1 median value or remained above the Wave 1 median value; 1 if they moved from at or below the Wave 1 median value to above the Wave 1 median value. The Wave 1 median value was 3 on a 1 to 5 scale. |
|
| 28 | Change in intention to turn out to vote | Participants were coded as: -1 if they moved from certain to vote to not certain to vote; 0 if they remained either not certain to vote or certain to vote; 1 if they moved from not certain to vote to certain to vote. |
| Change in vote choice | Participants were coded as: 0 if their answer in Wave 1 was the same as their answer in Wave 2; 1 if their answer in Wave 1 differed from their answer in Wave 2. |
|
| Change in expected future engagement in non-voting forms of political engagement | Participants were coded as: -1 if they moved from above the Wave 1 median value to at or below the Wave 1 median value; 0 if they remained at or below the Wave 1 median value or remained above the Wave 1 median value; 1 if they moved from at or below the Wave 1 median value to above the Wave 1 median value. The Wave 1 median value was 0.333 on a 0 to 3 scale. |
3.2 Social media research
Twitter is the site of much Canadian political discussion. Candidates, party leaders, journalists, electoral management bodies, and many Canadians use Twitter to keep up to date with recent political developments and to share their perspectives on politics. Of the approximately 35% of Canadians who use Twitter, 46% of these users (16% of all Canadians) use the platform to get political information.Footnote 2
There are other social media platforms on which Canadians discussed the 2021 election. These include Facebook, Instagram, YouTube, TikTok, Reddit, Tumblr, 4Chan, Gab, Rumble, Telegram, Discord, and many more. This report draws exclusively upon Twitter data given that it is almost entirely publicly available and accessible. Other social media sites may offer additional insights beyond those on Twitter, and further research should be done to evaluate the extent to which the findings on Twitter are reflective of the broader online community.
For this analysis, we use two Twitter data sources. First, we tracked a broad set of politics-related hashtags and keywords throughout the 2021 election—yielding a dataset of approximately 12 million tweets from two weeks before the writ period to two weeks after the writ period. In this group, we identified 84,560 individuals who consistently posted about Canadian politics on Twitter throughout the election. Second, we identified approximately 1.6 million likely Canadians based on their description and location and collected all tweets from them during the same period. We collected 265,835 accounts that actively tweeted on any subject throughout the election. This second dataset is more representative of the broader Canadian conversation on Twitter and allows insight into the extent to which Canadians use Twitter for politics and, of those, who commented on the debates. A full list of handles and hashtags tracked is available from the study authors upon request.
To help assess the content of tweets, we conducted a sentiment analysis using the Lexicoder dictionary (Young and Soroka 2012) for English-language texts, and a French-language translation of the Lexicoder dictionary for French-language texts (Duval and Pétry 2016). These tools identify a set of positive and negative word tokens that can be measured over a set of texts to classify those texts as generally negative or positive in tone. The proportion of positive to negative words allows the overall tone of a set of texts to be identified in an automated manner.
4 Findings
4.1 Public awareness in the run up to the debates
4.1.1 Overall awareness and across demographic groups
In the lead up to the debates, we asked participants in the first wave of the survey whether they were aware of each of the upcoming Commission-organized debates. Figure 1 presents the results for the September 8, 2021 French-language leaders' debate by participant language. Forty percent of French-speaking participants indicated that they had indeed "read, seen, or heard" something about the French debate; one-quarter of English-speaking participants said the same.
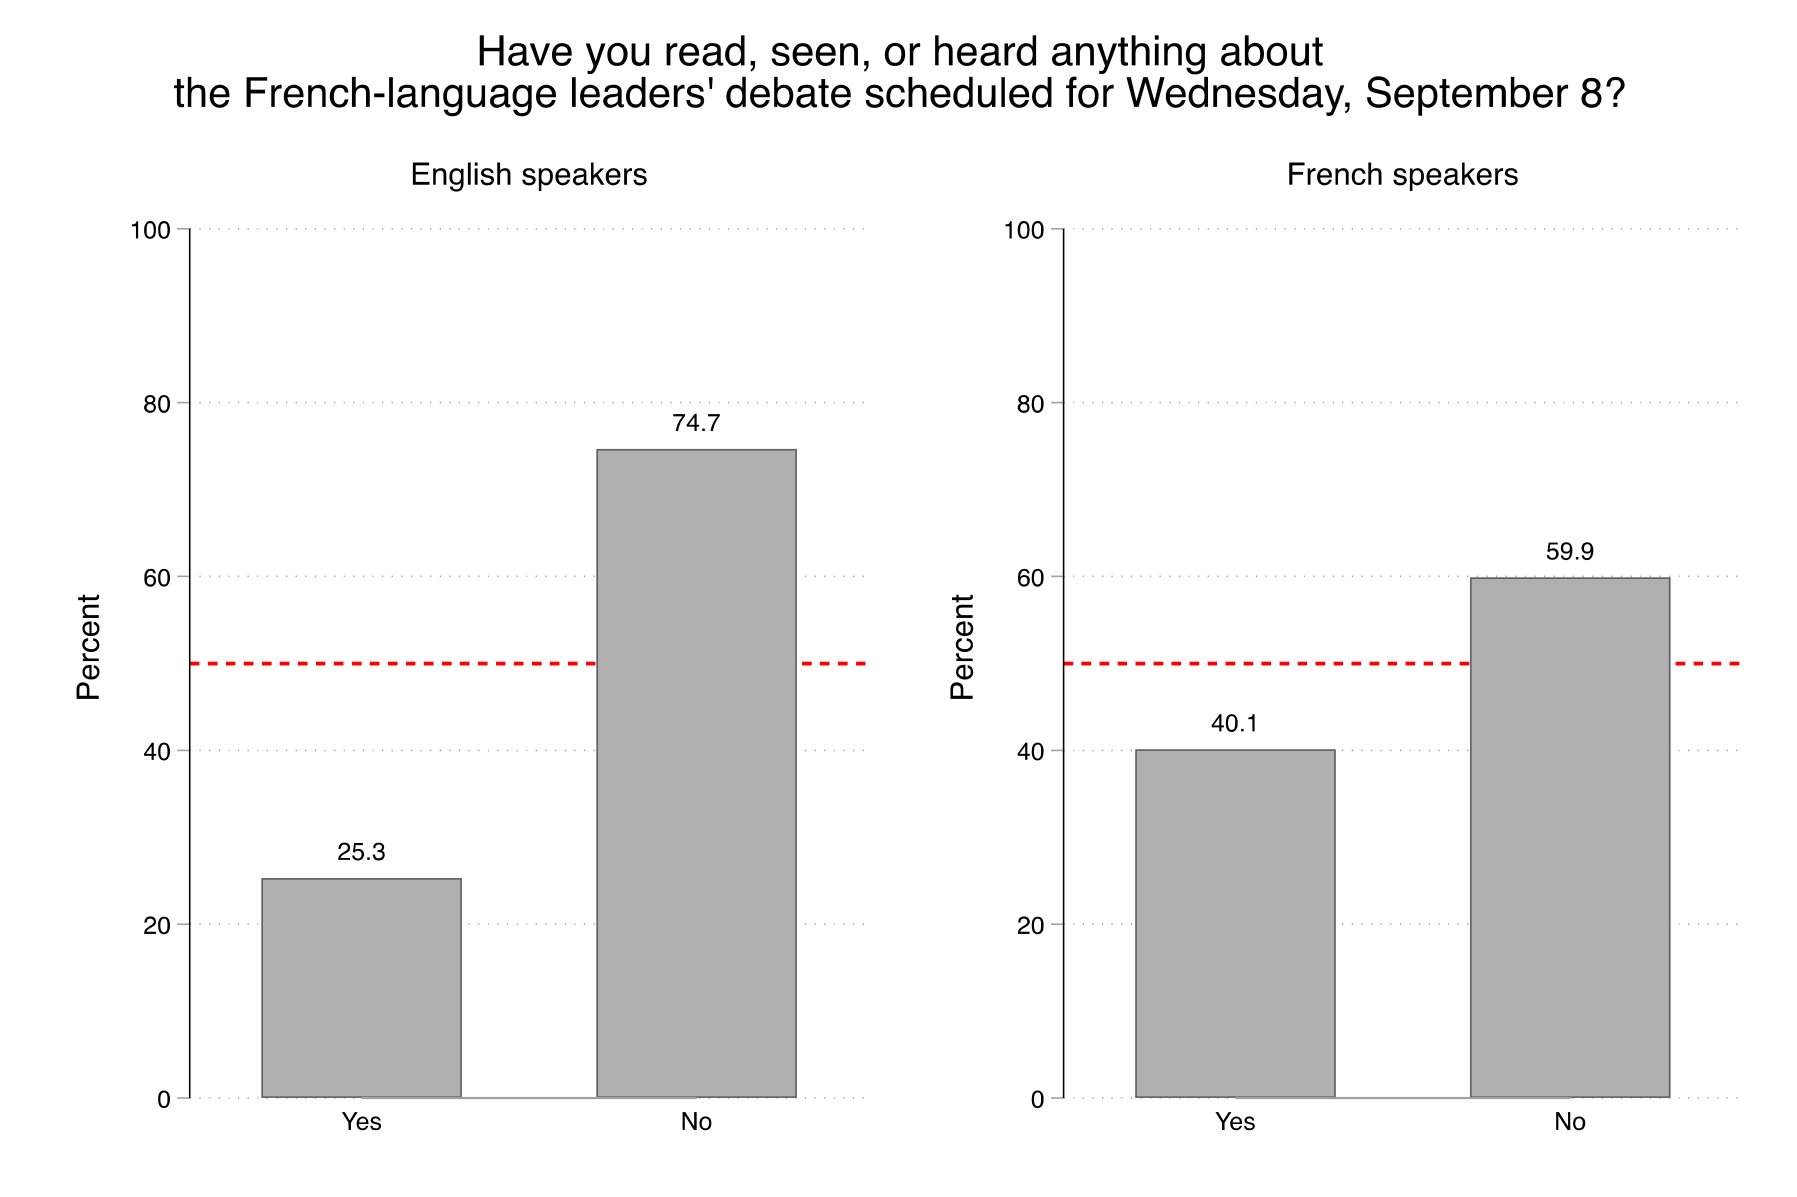
Figure 2 presents the results for the September 9, 2021 English-language leaders' debate—again by participant language. This time, 26% of English-speaking participants indicated that they had indeed "read, seen, or heard" something about the English debate, while 17% of French-speaking participants said the same.
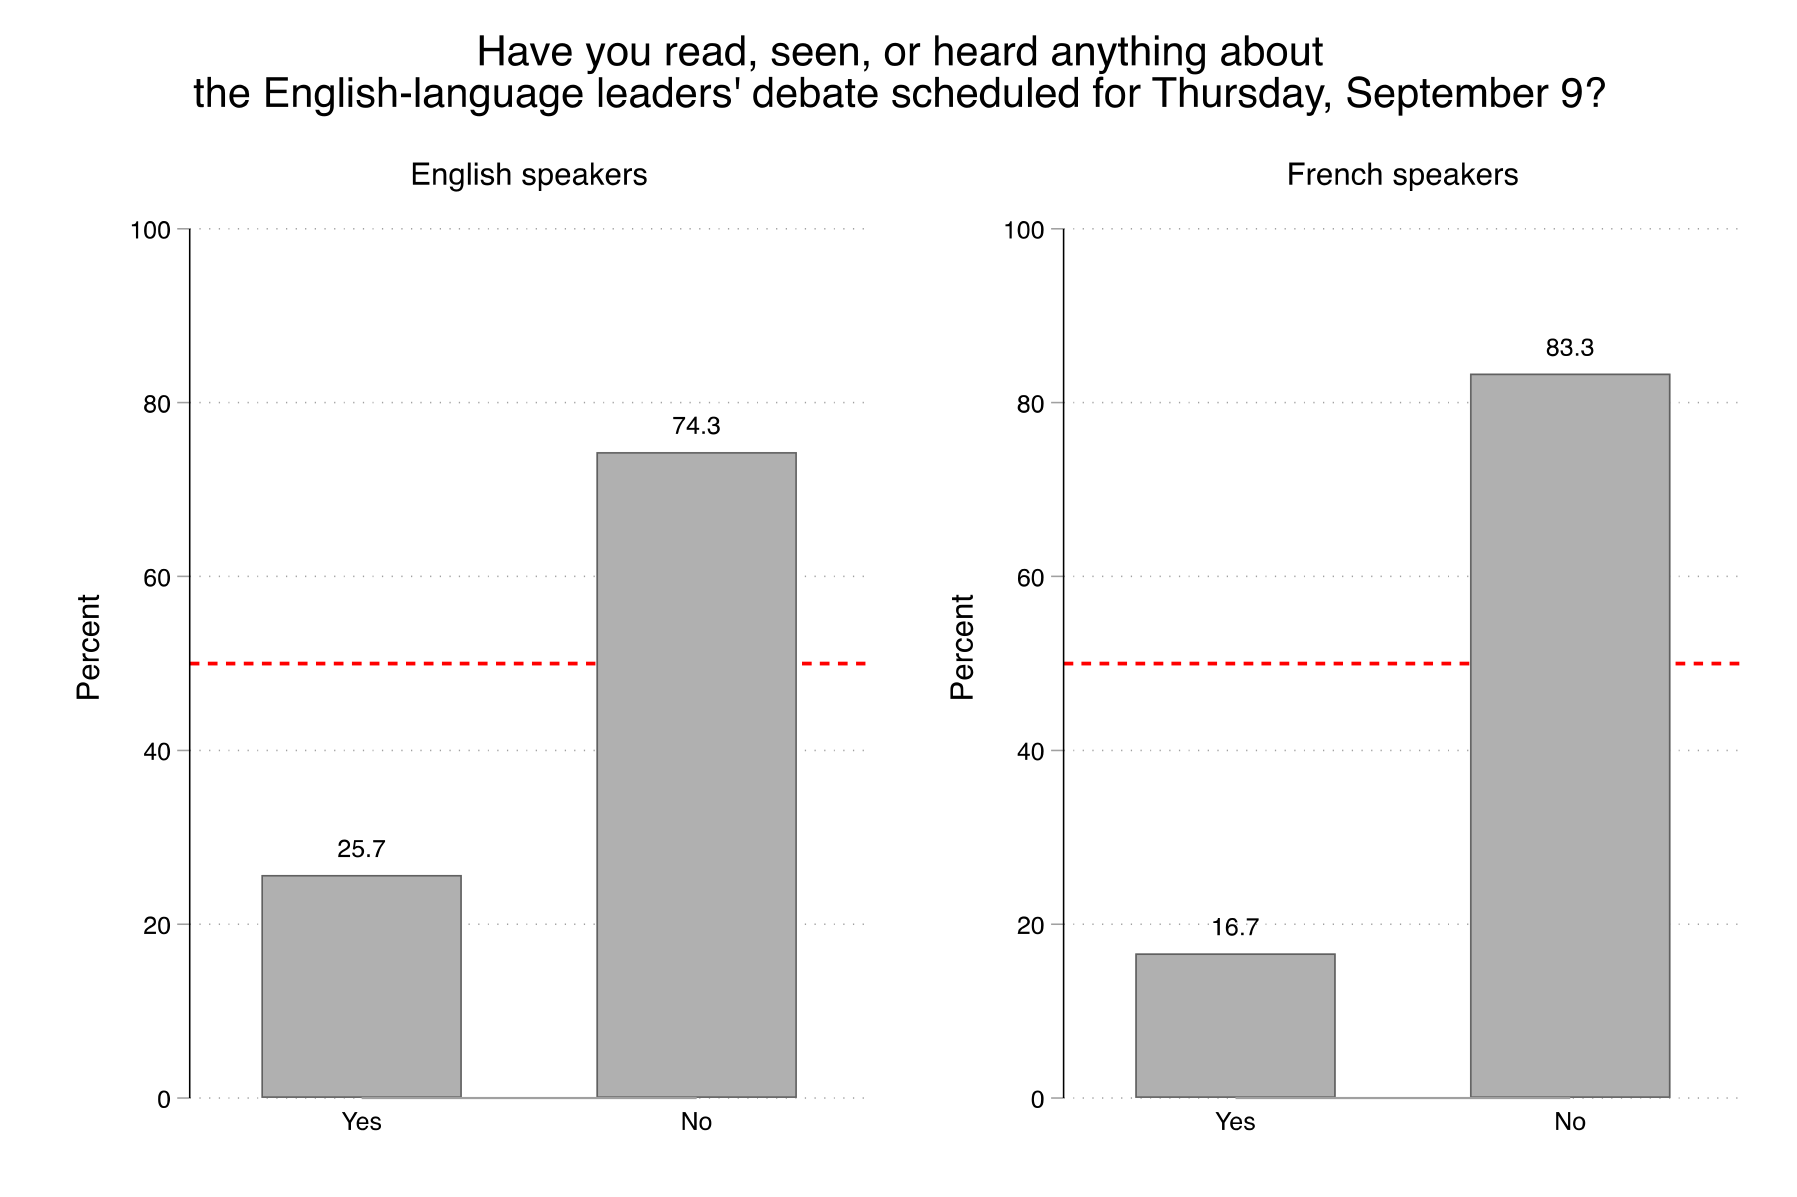
We highlight two points with regard to pre-debate awareness. First, and not very surprisingly, the awareness of a debate is greater among participants who speak the language of the debate: that is, greater among French speakers than English speakers for the French debate, and greater among English speakers than French speakers for the English debate. This is very likely a function of the media markets in which the debates are advertised and promoted.
Second, debate awareness is relatively modest. This low anticipatory salience is reflected in the analysis of the Twitter conversation in Section 4.1.2. While variation in individuals' attention to politics naturally places a limit on aggregate public awareness of the debates, and awareness of the election more broadly, there may still be opportunity to drive up debate awareness—particularly in the English market—in future federal election campaigns.
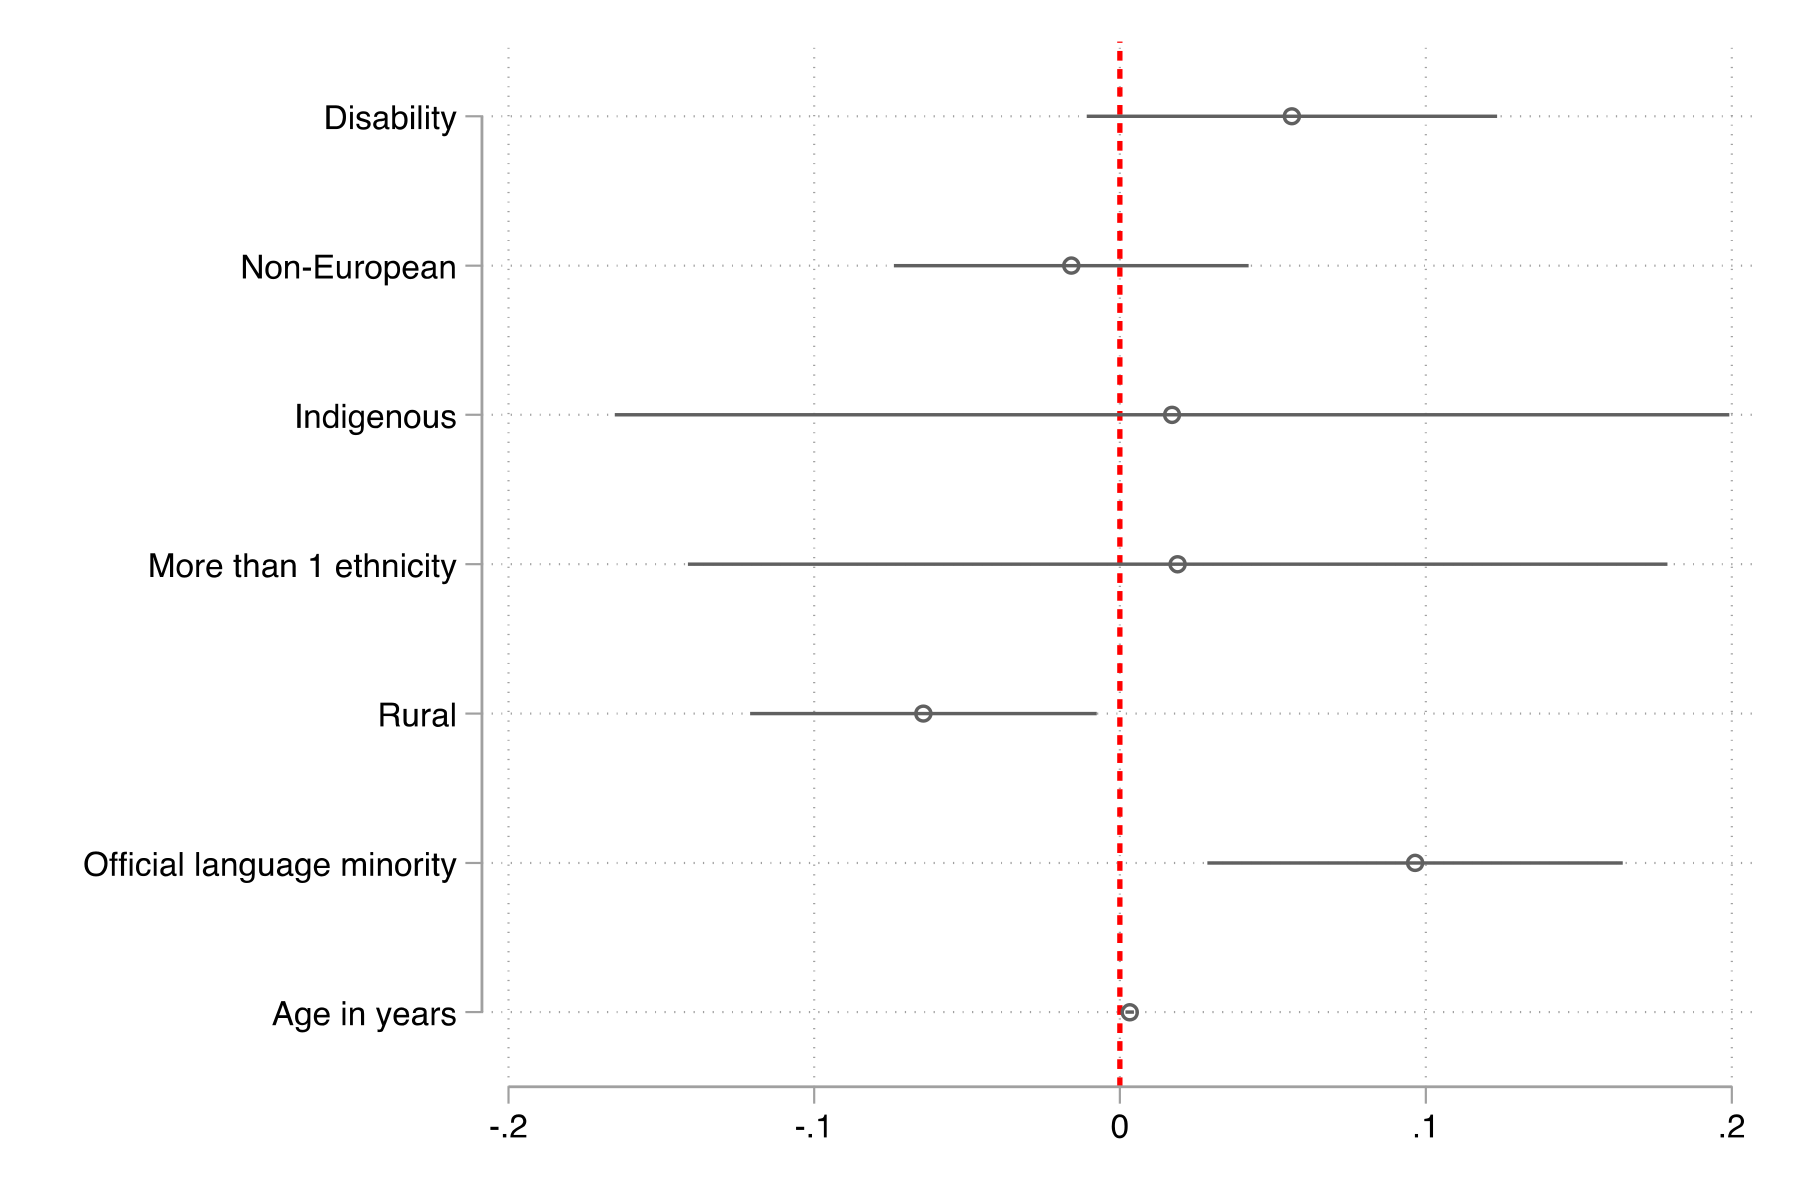
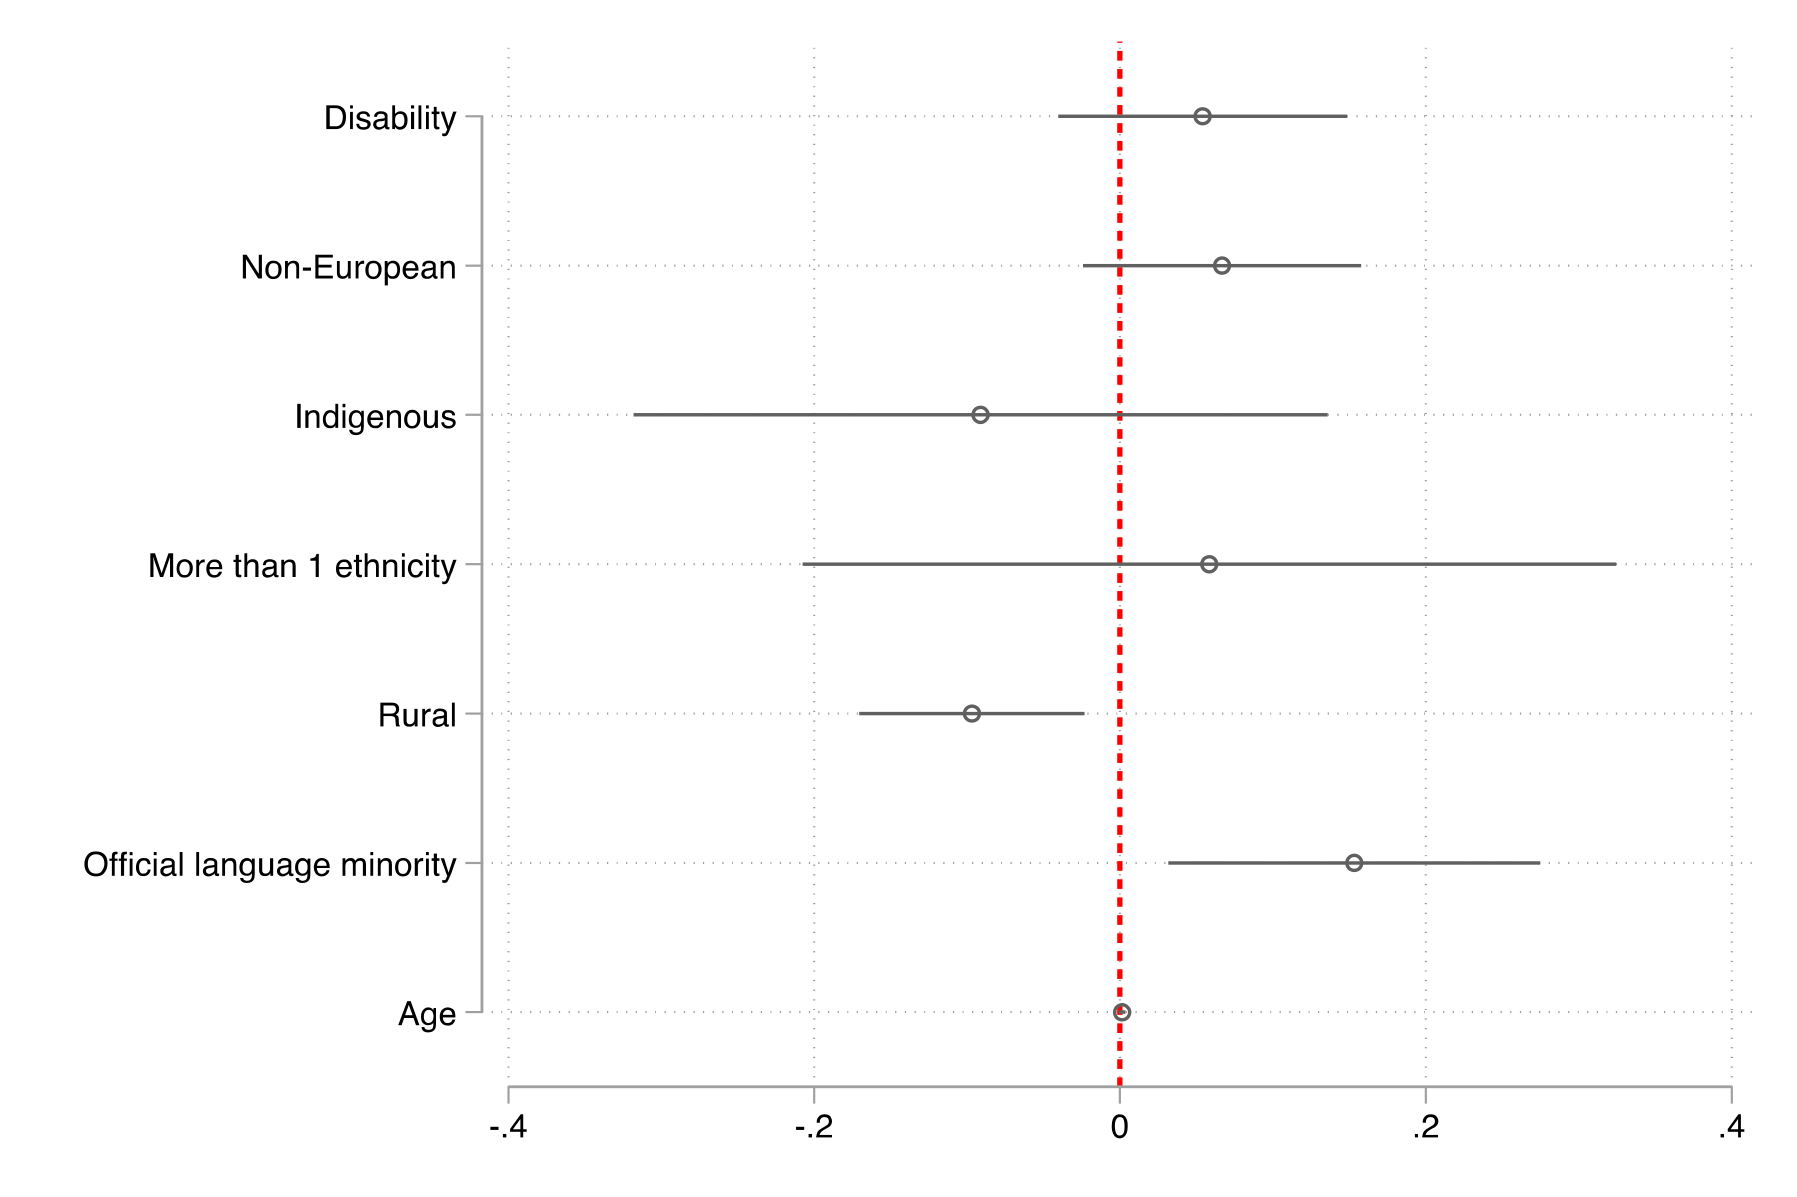
We also explored how awareness of the debates may have varied across particular demographic groups. To do this, we modeled a single binary indicator of debate awareness as a function of disability identity, ethnicity, rural/urban residence, official language minority status, and age. A plot of the OLS coefficients, and their associated 95% confidence intervals, are reported in Figure 3. We find that: (1) rural residents were roughly 6 percentage points less likely to be aware of the upcoming debates than urban residents; (2) official language minorities were roughly 10 percentage points more likely to be aware of the debates than those who are not official language minorities; and (3) each additional year of age is associated with a 0.3 percentage point increase in debate awareness. We did not find disability or ethnicity to be associated with differences in debate awareness at a conventional level of statistical significance.
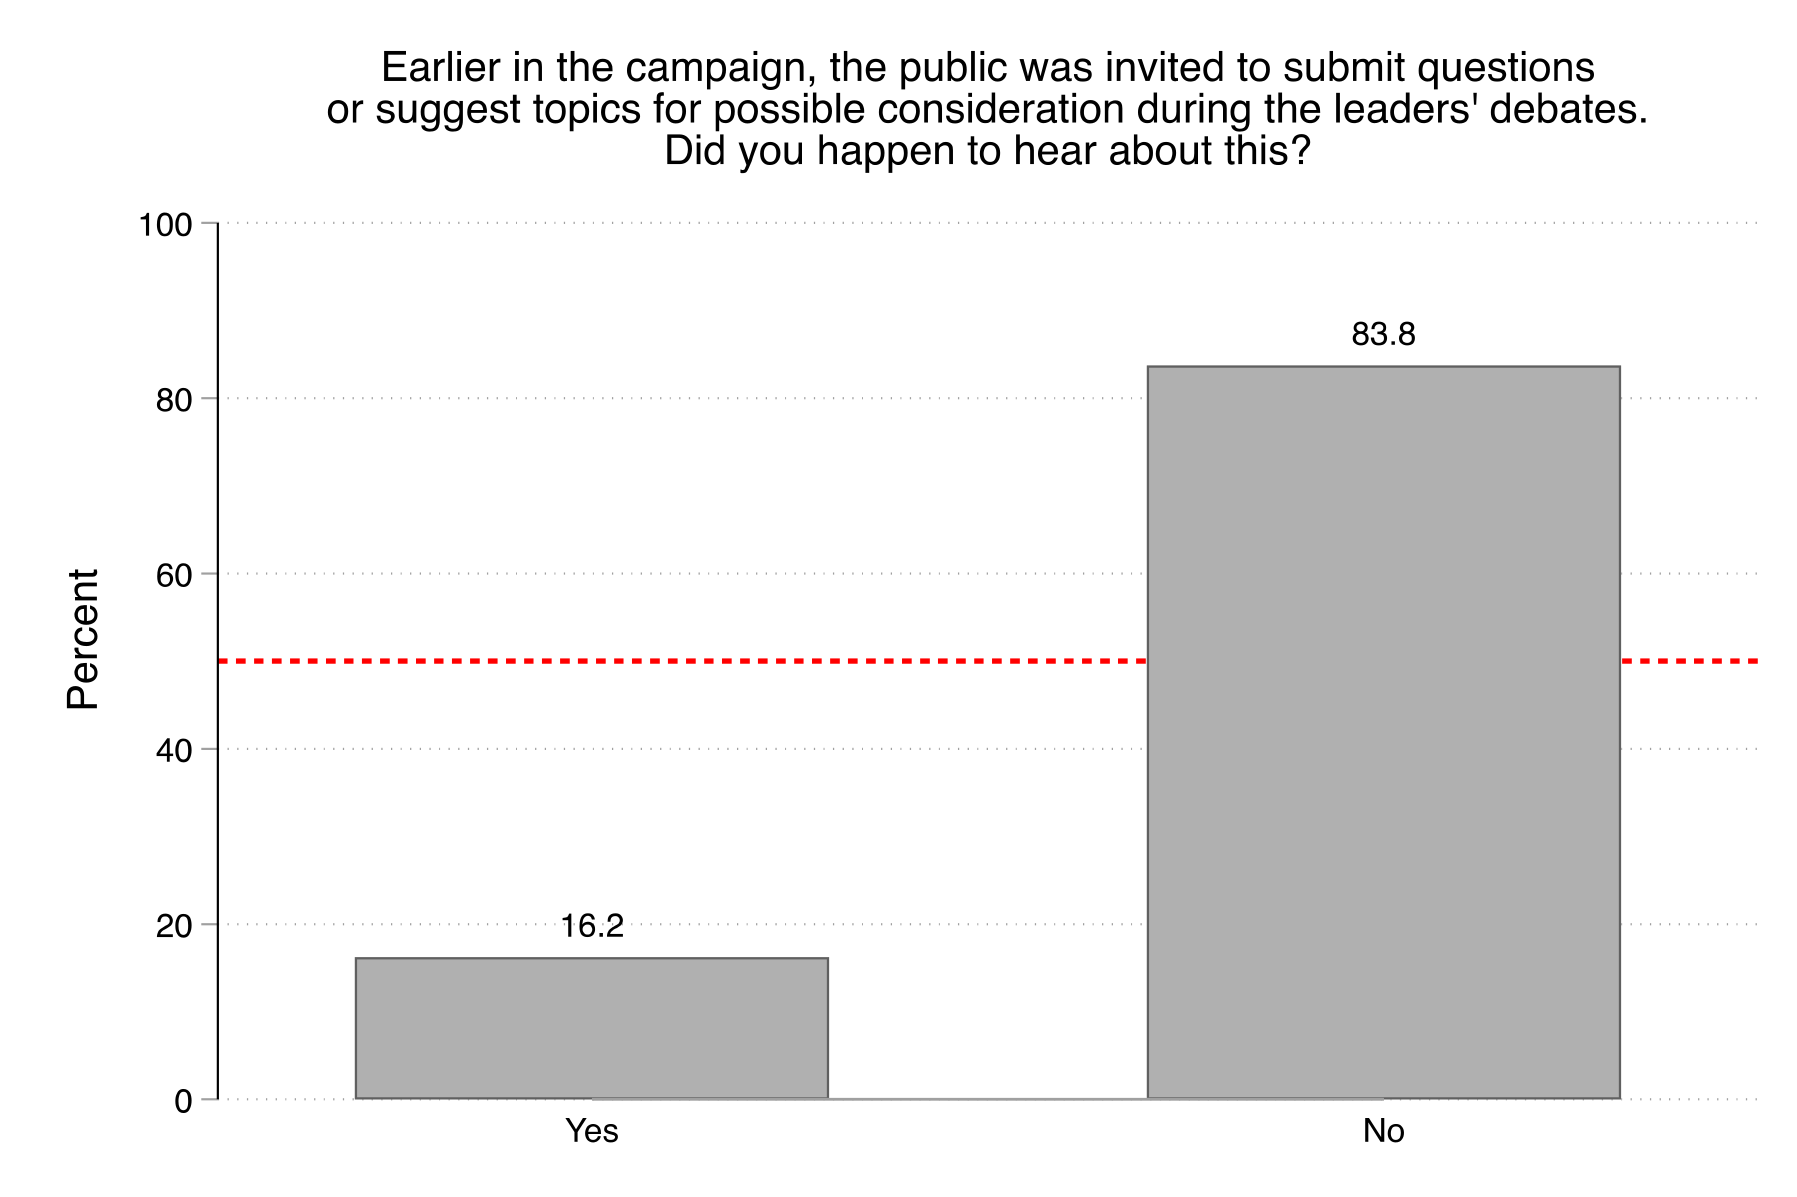
Prior to the debates, the public was invited to submit questions or topics for possible consideration during the debates. In the first wave of the survey, we asked participants whether they had heard about this opportunity. The results, reported in Figure 4, show that a very large majority had not. We find that only 16% of Canadians were aware that they could make these submissions. As with public awareness of the debates more broadly, there is an opportunity to expand the public's engagement in future election campaigns. Indeed, as we show in Section 4.7.3, there is significant public support for debates in which "regular citizens" put questions to the party leaders. Thus, expanded awareness about the question submission process may stimulate greater interest in the debates themselves.
4.1.2 Pre-debate mentions on Twitter
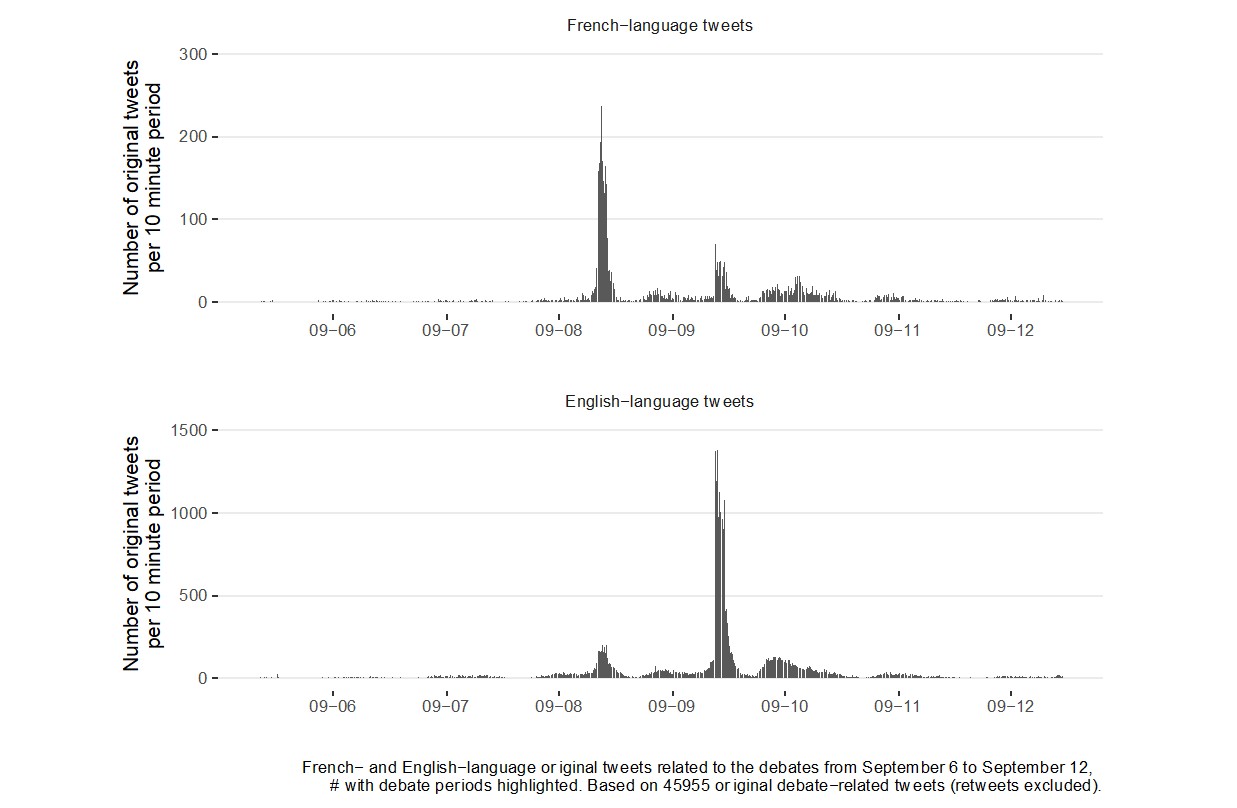
We also evaluated anticipation of the debates using Twitter data. Here we searched the Canadian politics tweet dataset for mentions of "debate," "débat," and moderator names. Figure 5 shows debate-related mentions from 3 days before the French-language leaders' debate to 3 days after the English-language leaders' debate. The top panel shows the volume of French-language tweets and the bottom panel shows the volume of English-language tweets. There was minimal anticipatory discussion on Twitter, with the bulk of the conversation happening during the debates themselves and during the day after the English-language debate.
4.2 Viewership of the debates
4.2.1 Overall viewership and across demographic groups
We analyzed viewership details using self-reports from the second wave of the survey. Figure 6 reports viewership of the French debate by participant language. We estimate that just under one-third of French-speakers (32%), mostly from Quebec, watched the September 8 French debate. Less than one in ten (8.4%) of English-speaking Canadians did the same.
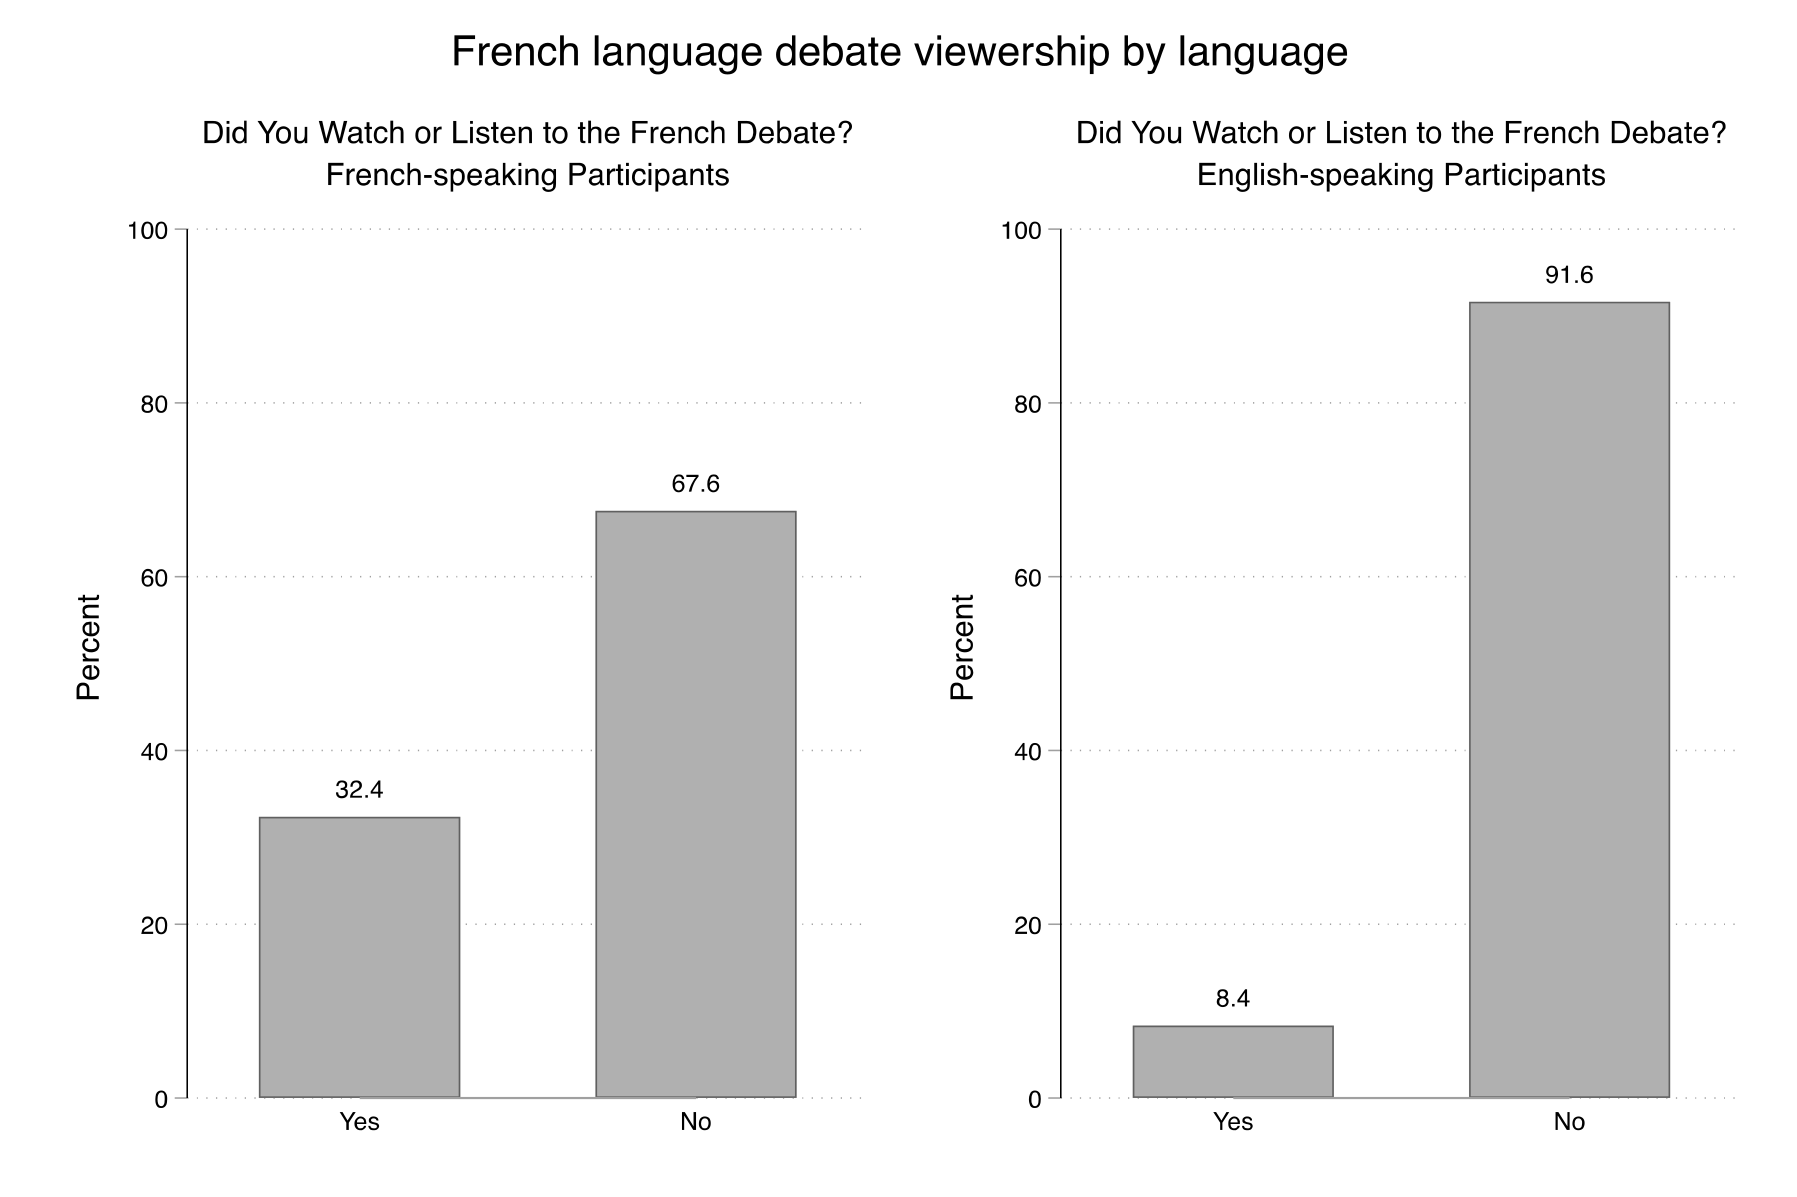
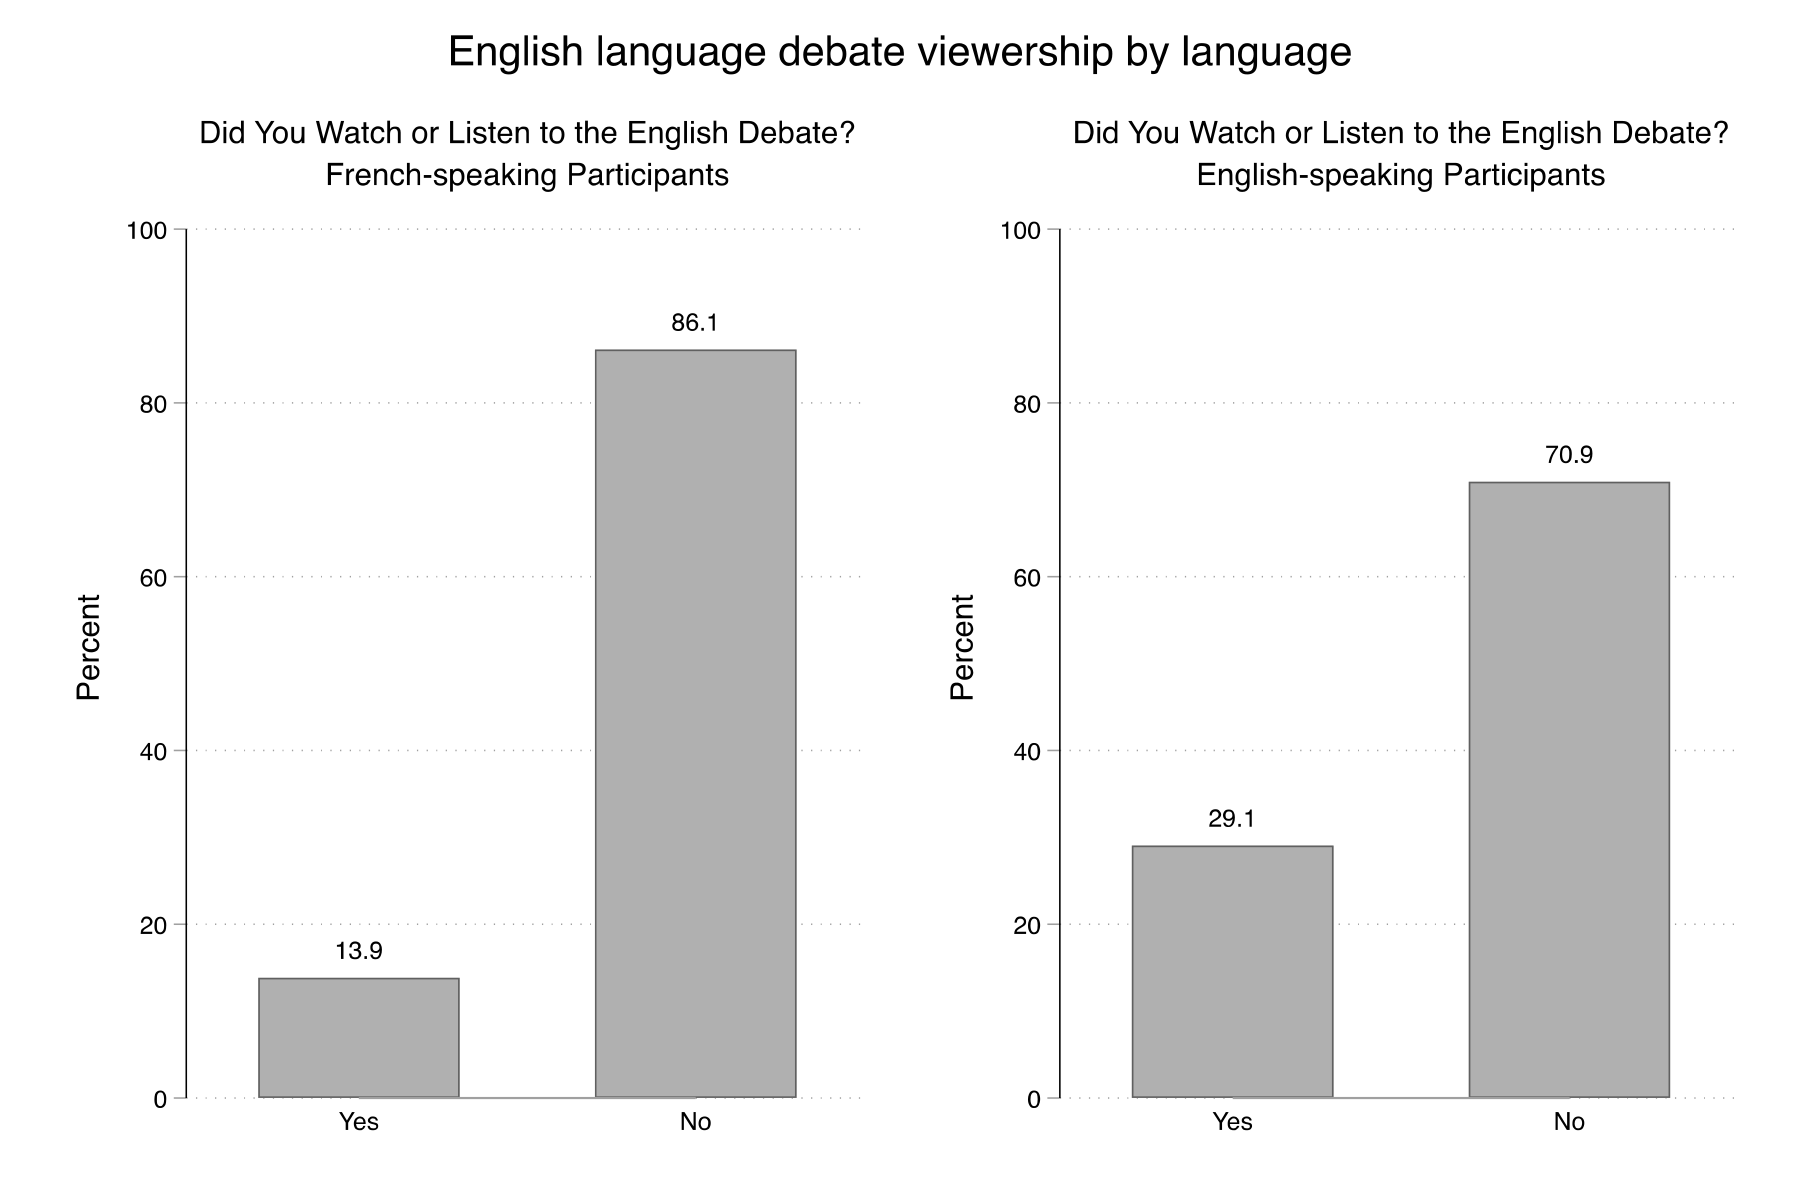
Figure 7 reports the viewership of the English debate—again disaggregated by participant language. We estimate that 29% of English-speakers watched the September 9 English debate—while 14% of French-speakers did the same.
As we did in our analysis of pre-debate awareness, we also examine how viewership of the debates varied across certain demographic groups. To do this, we modeled a binary indicator of debate viewership as a function of disability identity, ethnicity, rural/urban residence, official language minority status, and age. Figure 8 reports the OLS point estimates and their associated 95% confidence intervals. These results point to a pattern similar to that of pre-debate awareness. We find that: (1) rural residents were approximately 10 percentage points less likely than urban residents to watch a debate; and (2) official language minorities were 15 percentage points more likely to watch a debate than those who are not official language minorities. Disability identity, ethnicity/ancestry, and age did not have a statistically significant impact on debate watching at the p < .05 level.
4.2.2 Duration of viewership
We deepened our understanding of viewership patterns by asking those who watched/listened to a debate: how much time did you spend watching or listening? The distribution of responses is reported in Figure 9. The pattern is similar for both debates: a majority of those who tuned in did so for a majority of the time. Roughly one quarter of the viewership of each debate tuned in for the entire two-hour debate. At the same time, roughly 35% of the French debate viewership—and 37% of the English debate viewership—watched/listened for 30 minutes or less.
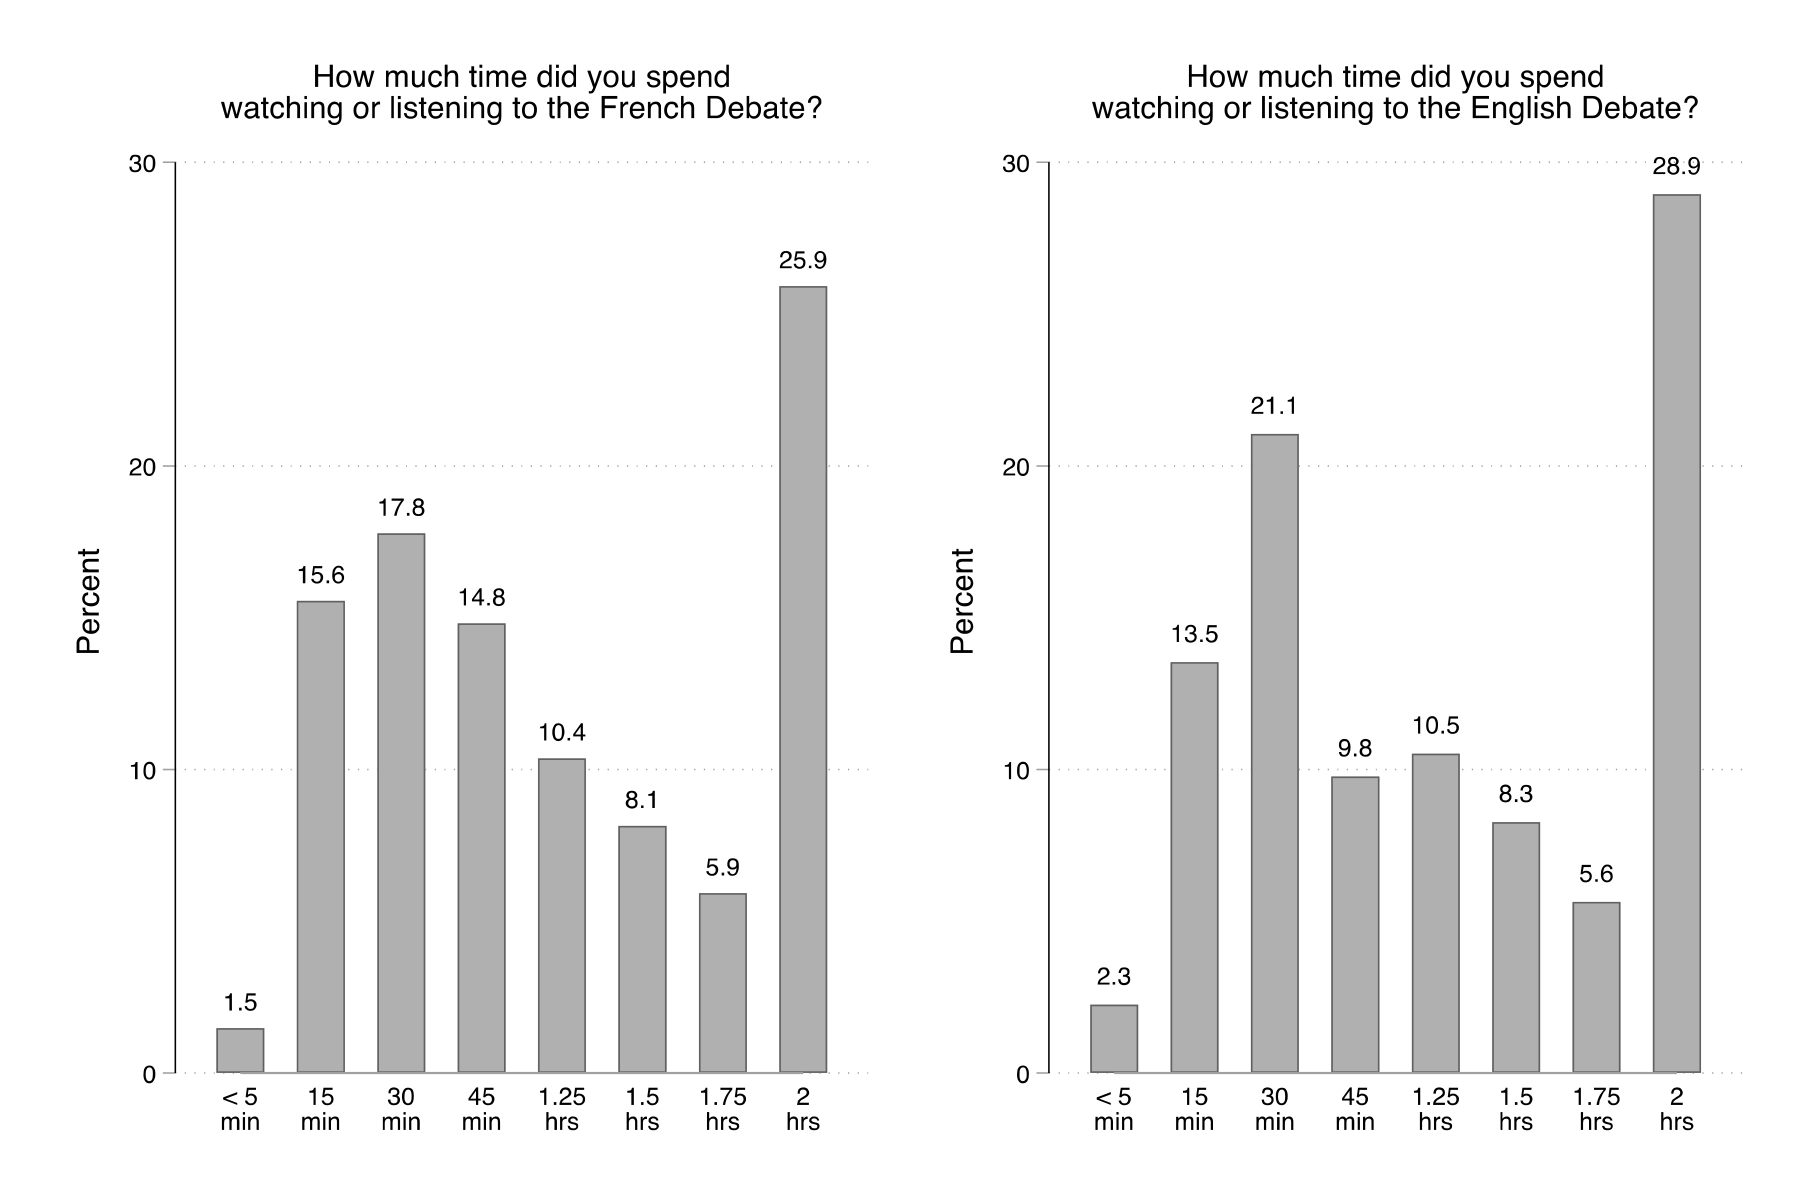
We believe that these findings—particularly the fact that only about a quarter of the viewership watched/listened to the full two-hour debate—is an important point of reflection for understanding how Canadians choose to consume modern leaders' debates. It also provides some additional context when interpreting the impacts of debate viewership set out in Section 4.6.
4.2.3 Viewership medium
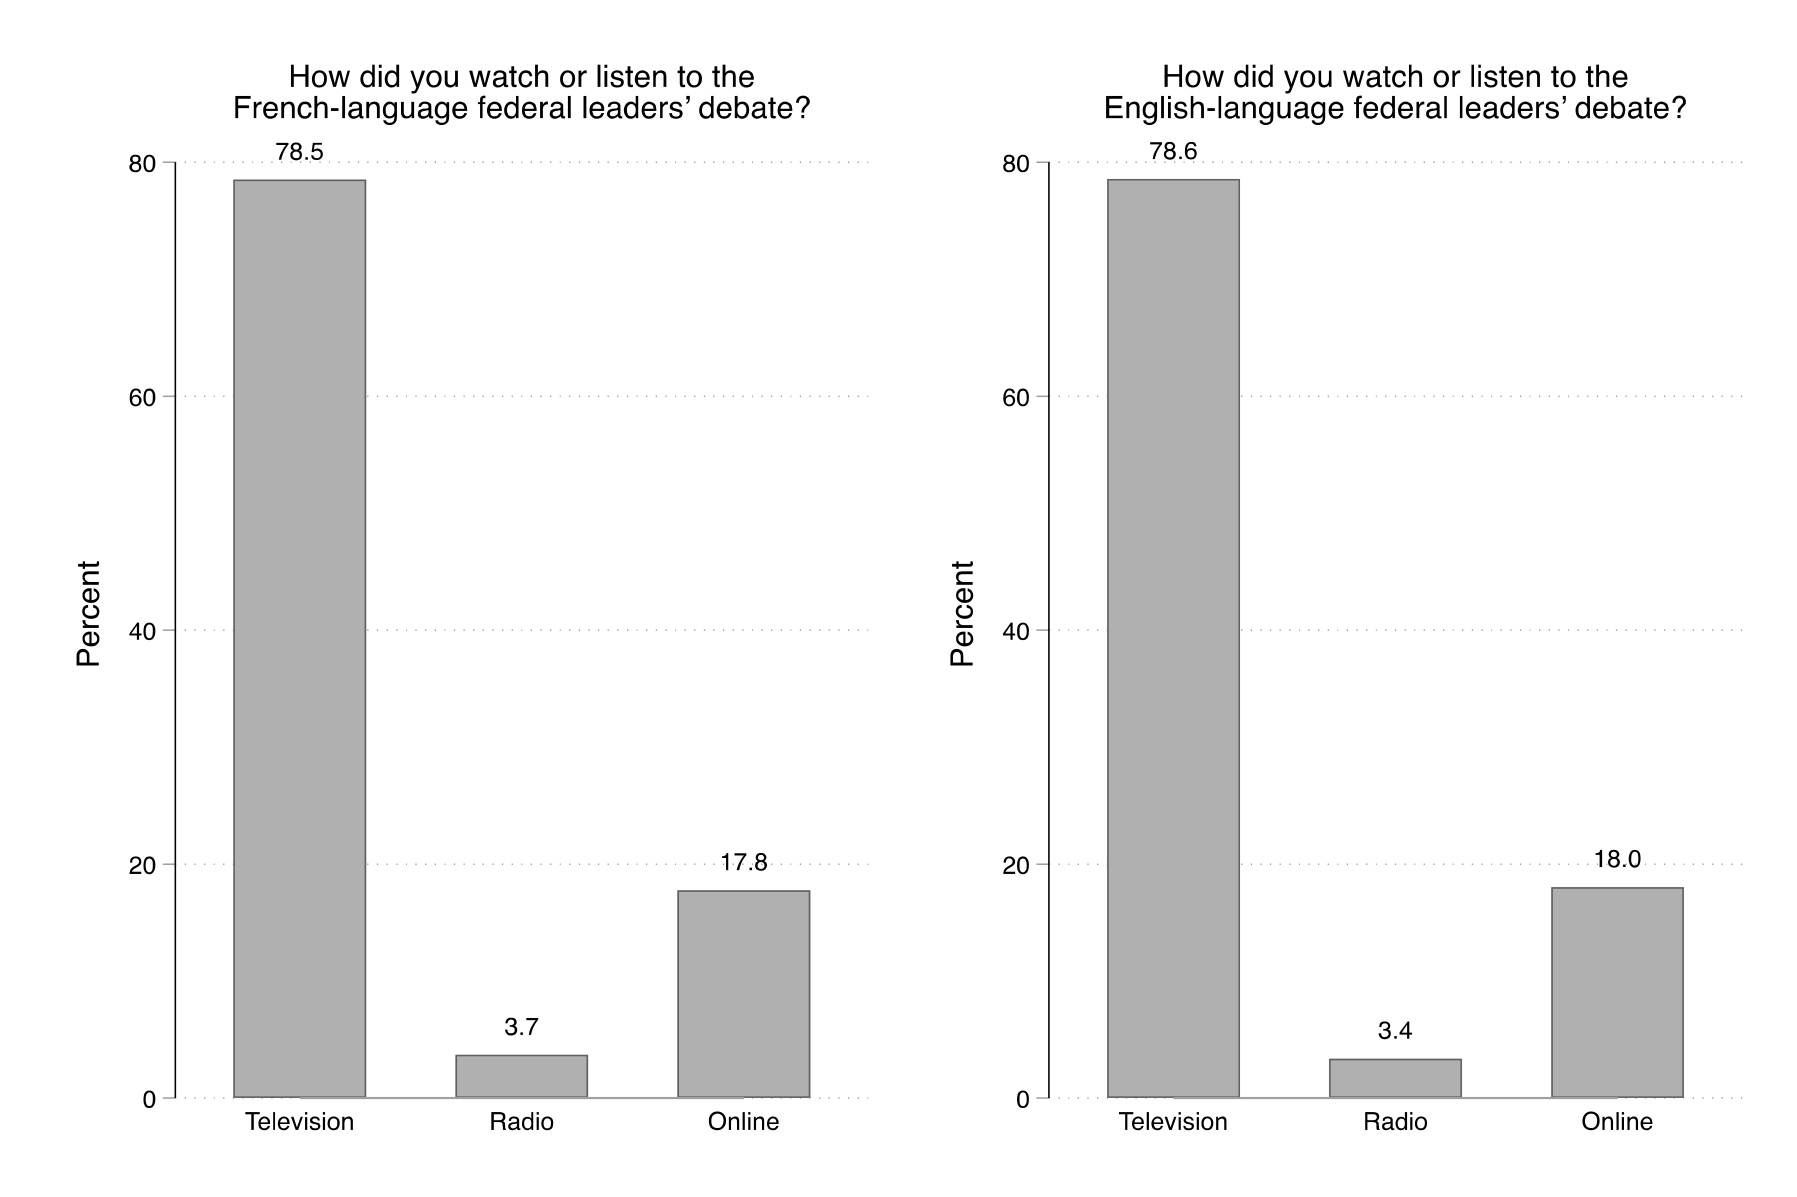
Debate viewers were also asked how they watched the debates: i.e., on television, on the radio, or online. The results are reported, for both debates, in Figure 10. The findings are virtually identical for the French and English debates: the vast majority of viewers—nearly four in five—watched on television. Just under one in five watched online and only 3-4% listened on the radio. In short, television remains the dominant medium of debate consumption.
4.3 Reasons for not watching the debates
For those who indicated they did not watch a debate, we probed further—asking what was the main reason they did not watch. Figure 11 reports the answers for non-watchers of the French debate and Figure 12 reports the same for non-watchers of the English debate.
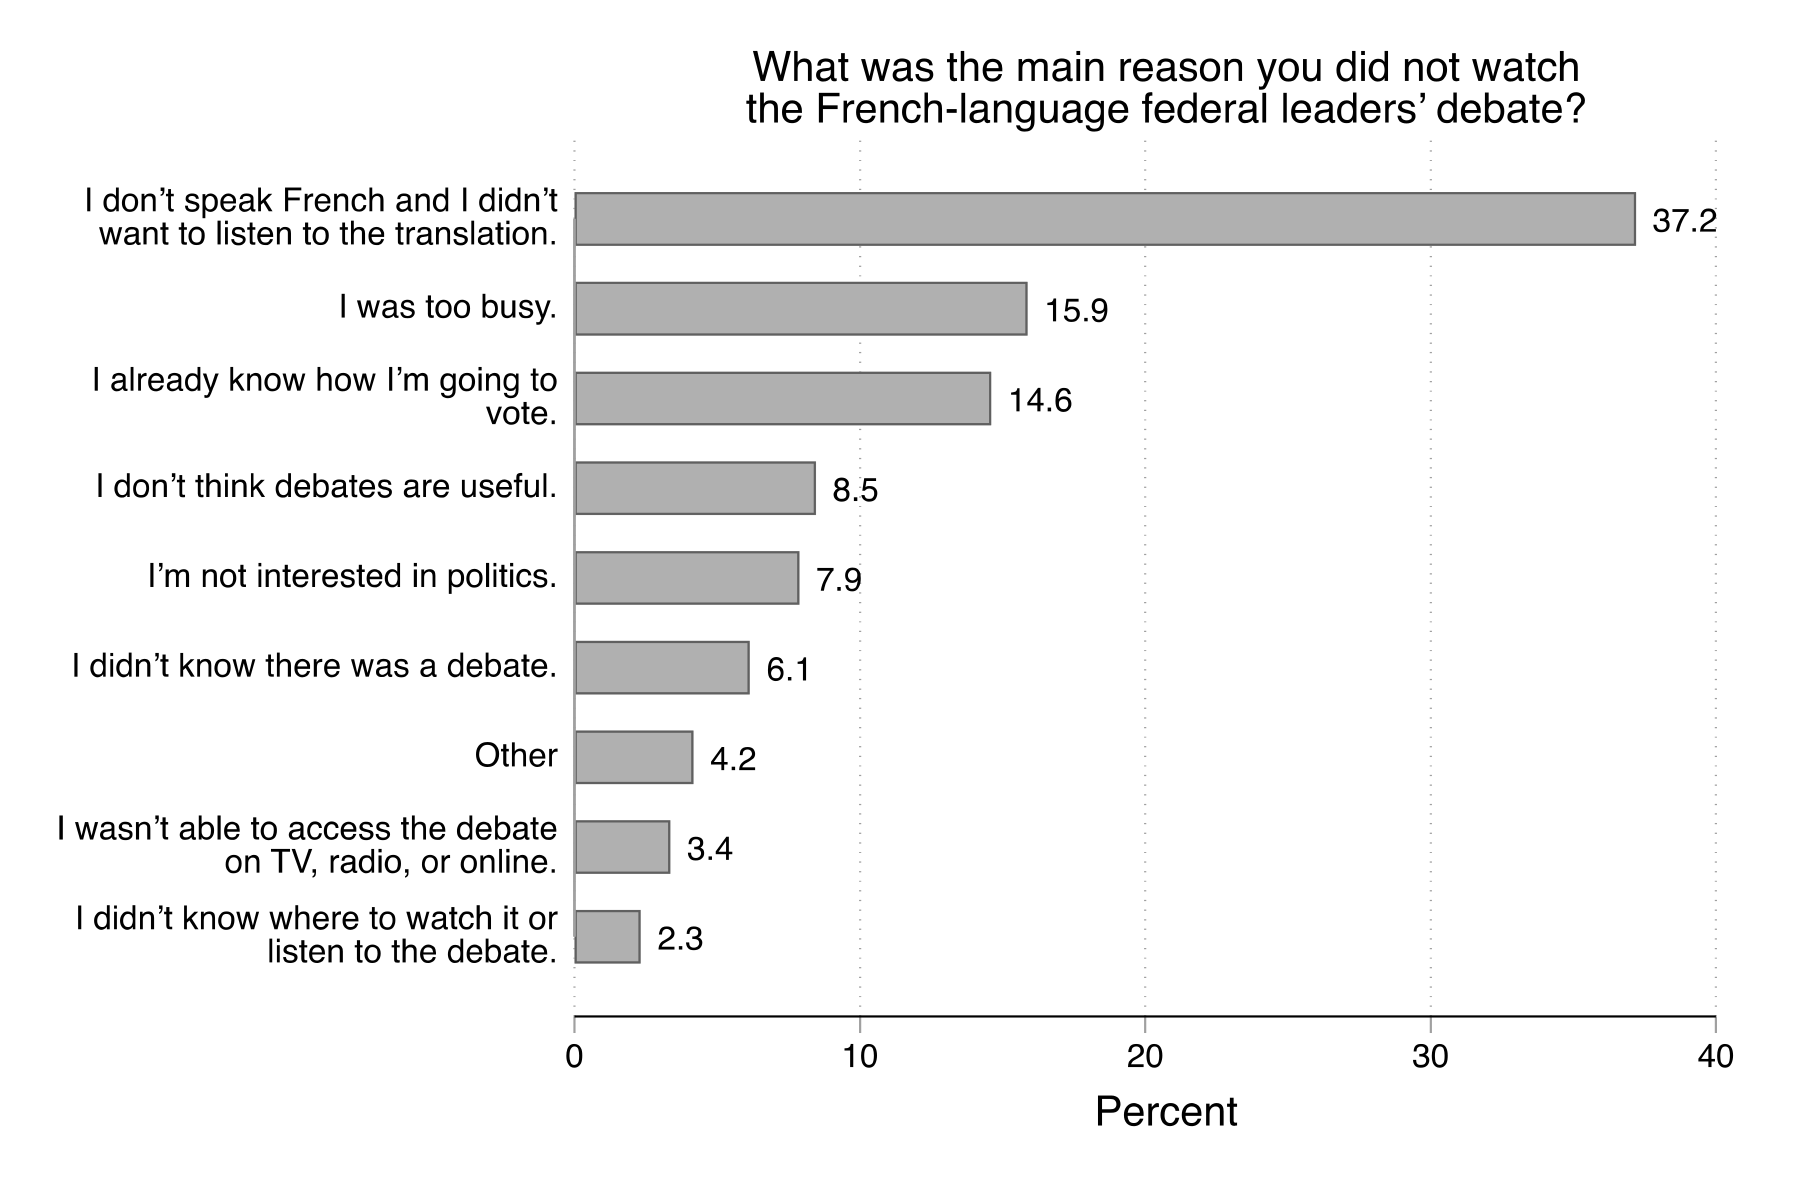
The most common answer for not watching the French debate was that the participant did not speak French and didn't want to listen to the translation—perhaps not surprising given that this question was put to everyone who did not watch the French debate, French- and English- speakers alike. The second most common response was "I was too busy" (16%). Another common set of responses all pertain to a perceive lack of use for the debate or a lack of interest in politics more broadly: "I already know how I'm going to vote (15%); "I don't think debates are useful" (8%); and "I'm not interested in politics" (8%). A further, smaller subset of responses reflected a lack of awareness of or access to the debates: "I didn't know there was a debate" (6%); "I wasn't able to access the debate" (3%) and "I didn't know where to watch or listen to the debate" (2%).
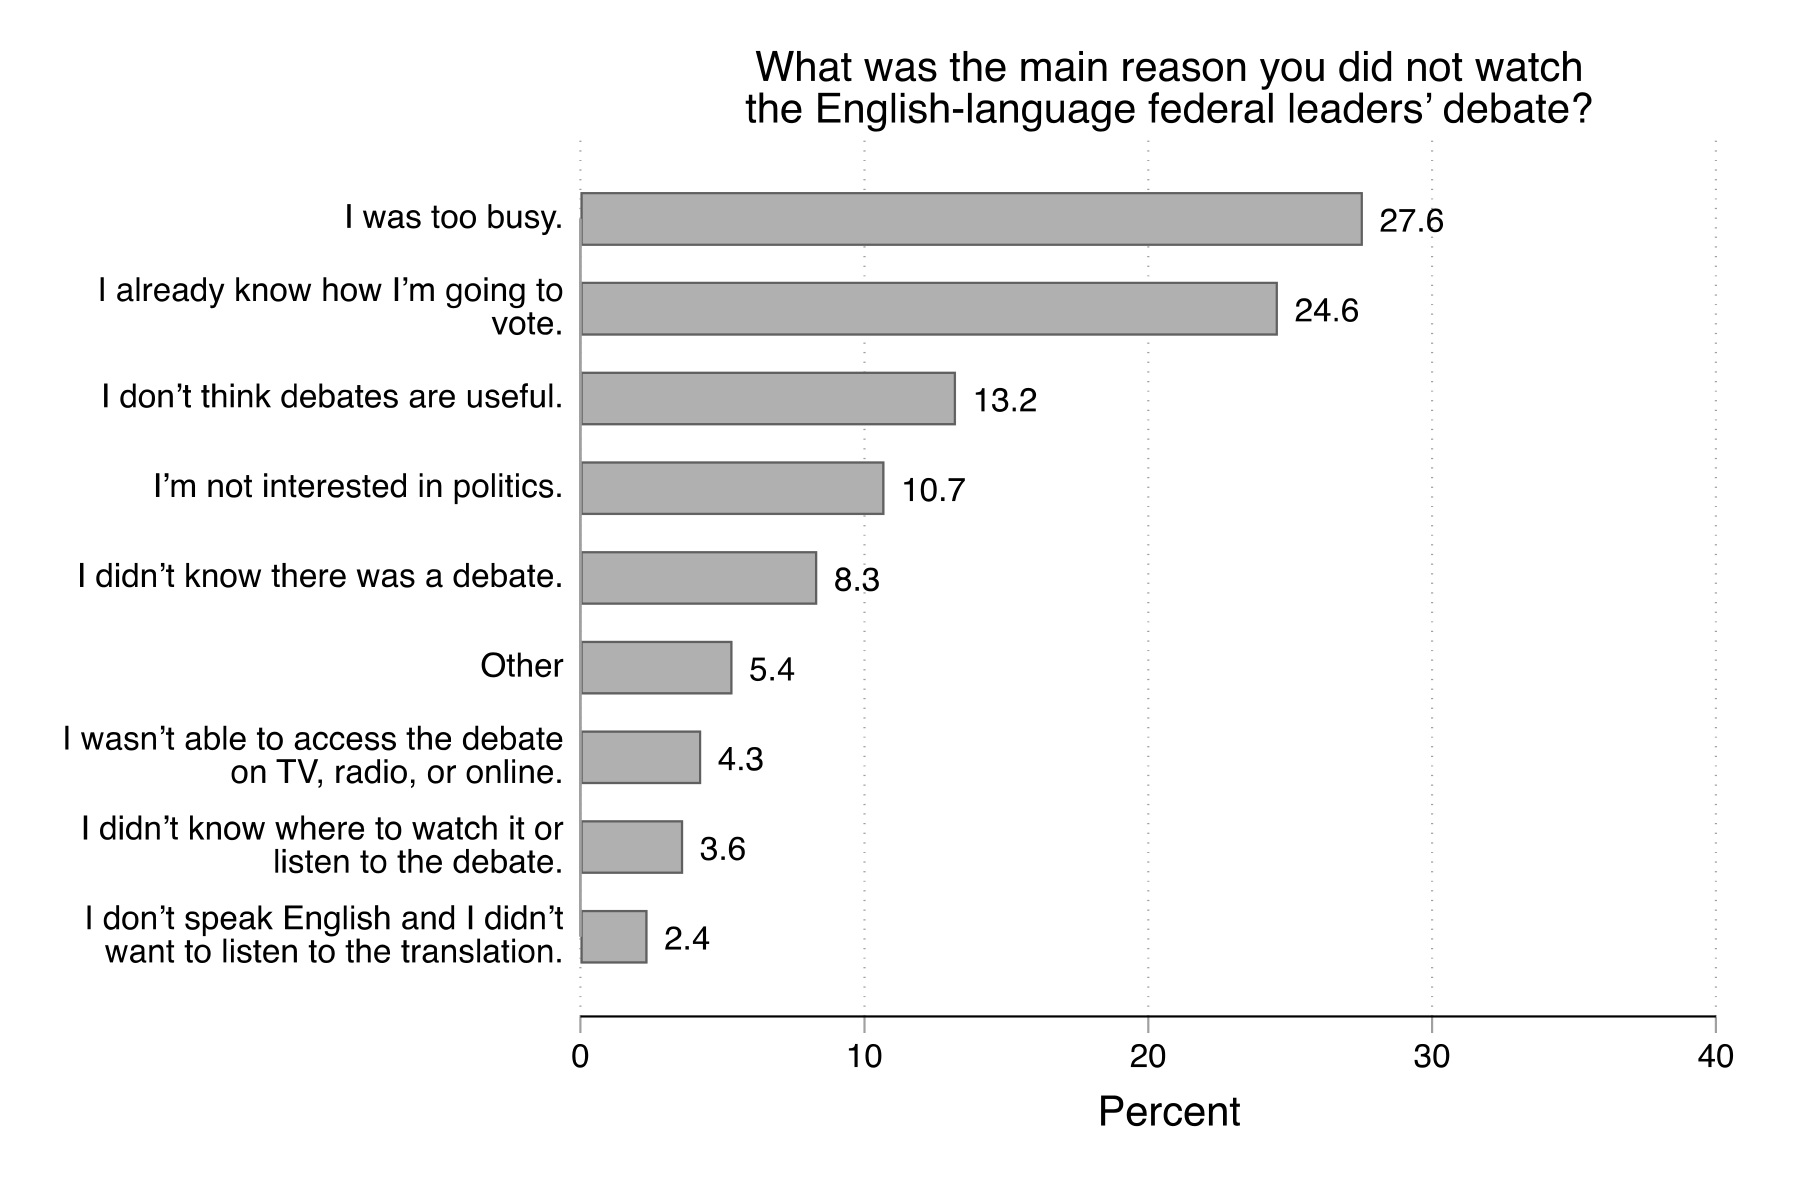
With the exception of the language-based reason, the responses for non-watchers of the English debate largely mirror the responses for non-watchers of the French debate. The most common response (28%) was "I was too busy." The next most common set of responses again underscored a perceive lack of value or interest in the debate and in politics: "I already know how I'm going to vote" (25%); "I don't think debates are useful" (13%); and "I'm not interested in politics" (10.7%). Only a small proportion of non-watchers of the English debate attributed not watching to a lack of awareness or access: "I didn't know there was a debate" (8%); "I wasn't able to access the debate" (4%) and "I didn't know where to watch or listen to the debate" (4%).
These results are encouraging in that the reasons for not watching a debate do not typically come down to a technical problem with access: only 5-10% of non-watchers said they didn't watch because they didn't have access to the debate or didn't know how to access the debate. By contrast, a significant proportion attribute not watching to a lack of interest. While there is likely opportunity to convince some of these Canadians of the value of the debates, future viewership will naturally be constrained by individuals' interest in politics. The response of being "too busy" to watch is more difficult to interpret. For some it could again reflect a lack of interest in the debate, but for others it may reflect irresolvable scheduling conflicts such as work or childcare. This suggests further reflection in terms of when to schedule a debate given Canadian time zones—as well as whether more can be done to promote access to clips of the debates after the fact. (In Section 4.7.6, we take up the question of when Canadians would like to watch a debate live.)
4.4 Engagement with the debates
4.4.1 Engagement on Twitter
The leaders' debates were important junctures during the election on Twitter. Figure 13 shows the volume of Canadian-politics related tweets from August 8 to September 28, 2021, with the top panel showing French-language tweets and the bottom panel showing English-language ones. September 8 and 9, when the leaders' debates were held, were among the most concentrated period of discussion of Canadian politics in both languages. The day of the French debate witnessed, by a large margin, the most French-language politics-related Twitter activity of the campaign—substantially outstripping Election Day itself. The day of the English debate had the second highest English-language politics-related Twitter activity of the campaign, again higher than on Election Day.
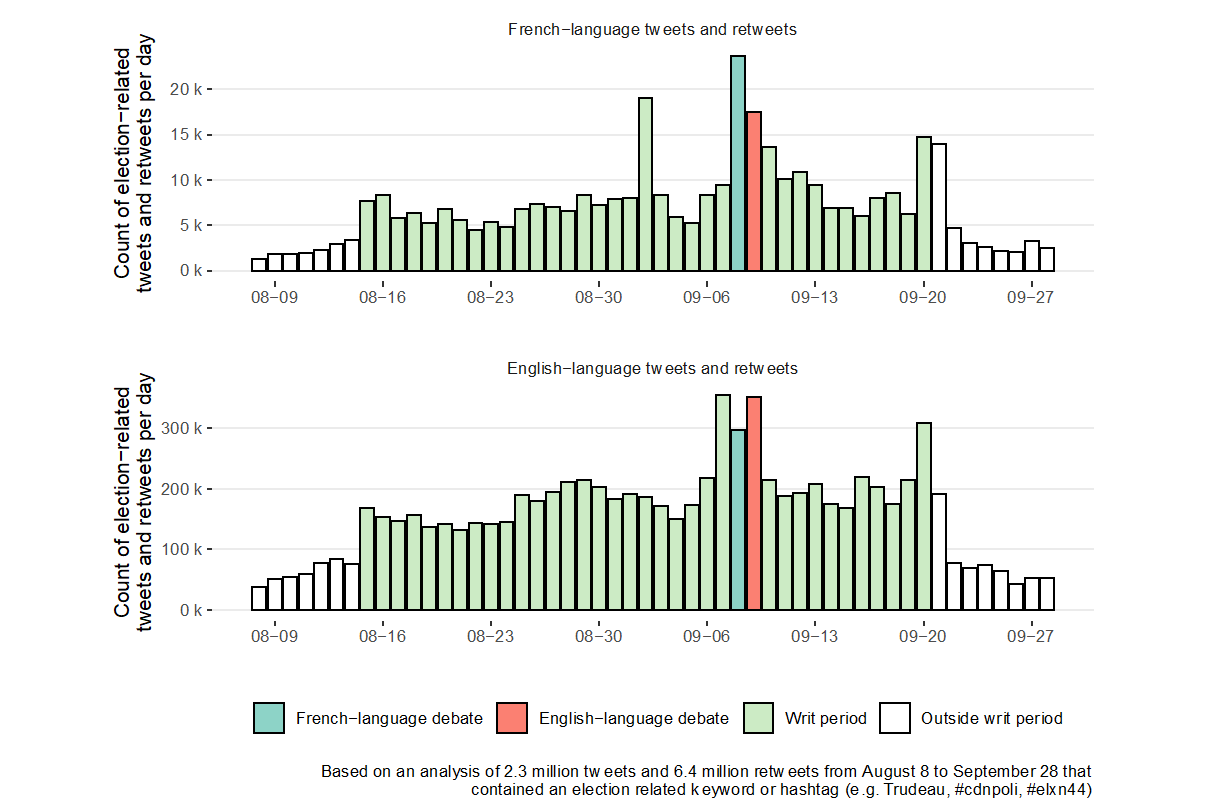
In addition, we identified debate-related tweets based on keywords, again using "debate," "débat," moderator names, and party leader names. A total of 107,889 debate-related tweets and retweets were posted in the four hours of the two debates: 31,090 during the French-language debate and 76,799 during the English-language debate.
Throughout the election, we identified 84,560 accounts that habitually post about politics and evaluated the extent to which this politically active group also shared their opinions during the leaders' debates. Figure 14 shows the number and percentage of users who habitually comment on Canadian politics who live-tweeted the debates.
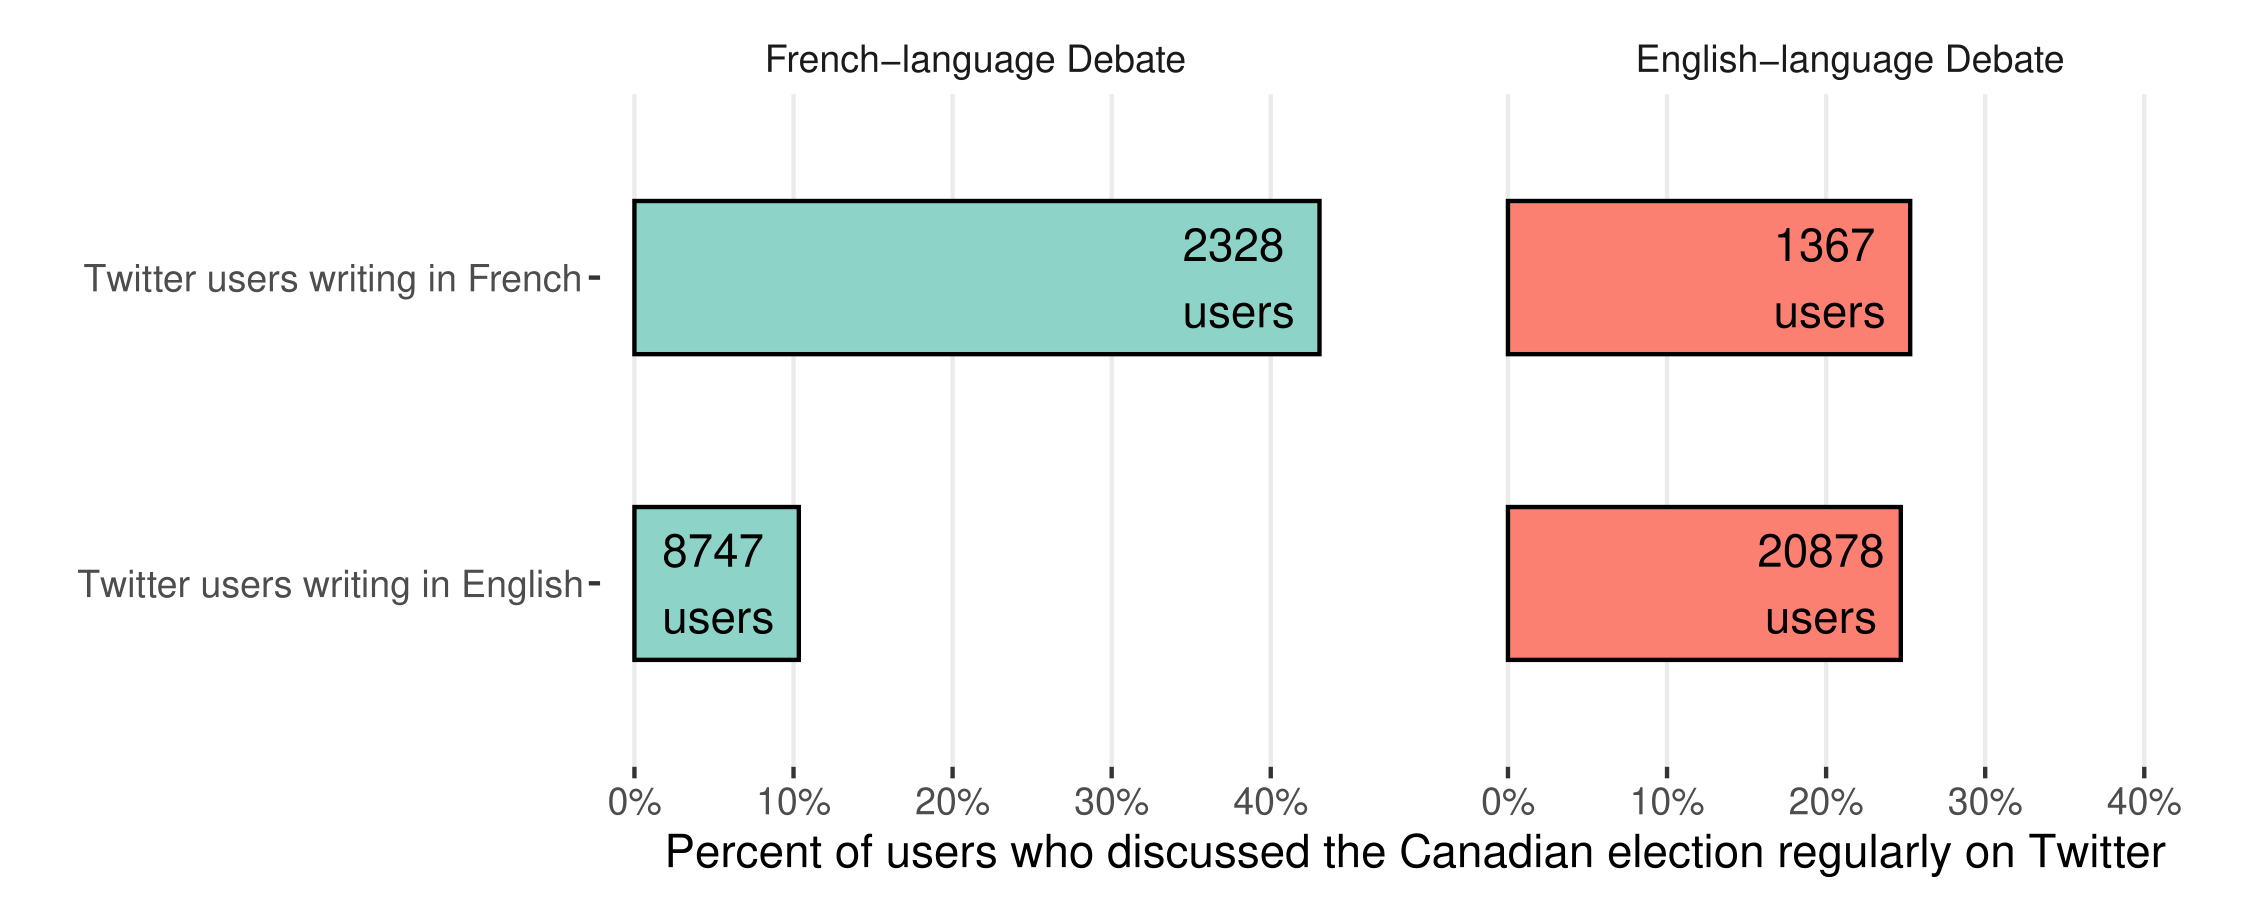
Over 40% of the habitually posting French-language users posted in the two-hour window of the French-language debate, while only about 11% of English-users did so. Just over 25% of both French- and English-language users live tweeted about the English-language debate. The topics and content of these tweets was varied and included cheering on particular party leaders, discussing the debate format and content, and commenting on specific policy areas.
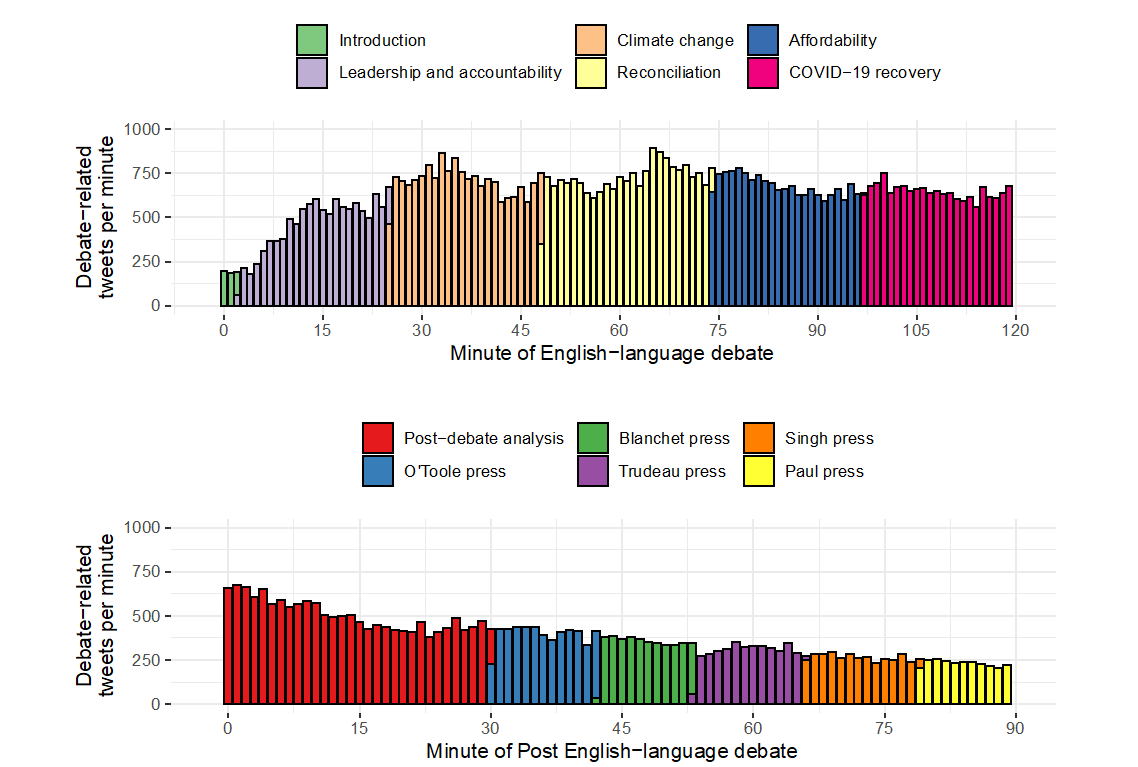
Looking deeper into the debate-related conversation during the two debates on Twitter, we can examine the volume of tweets during and immediately after each debate. Figures 15 and 16 show these results. The debates are divided into their thematic areas based on the time of the tweet—with the bottom plot showing the post-debate analysis and post-debate media scrums with the leaders. The volume of conversation on Twitter increased throughout both the English- and French-language debates. Caution, however, should be taken in attributing changes in tweet volume to changes in debate topic.
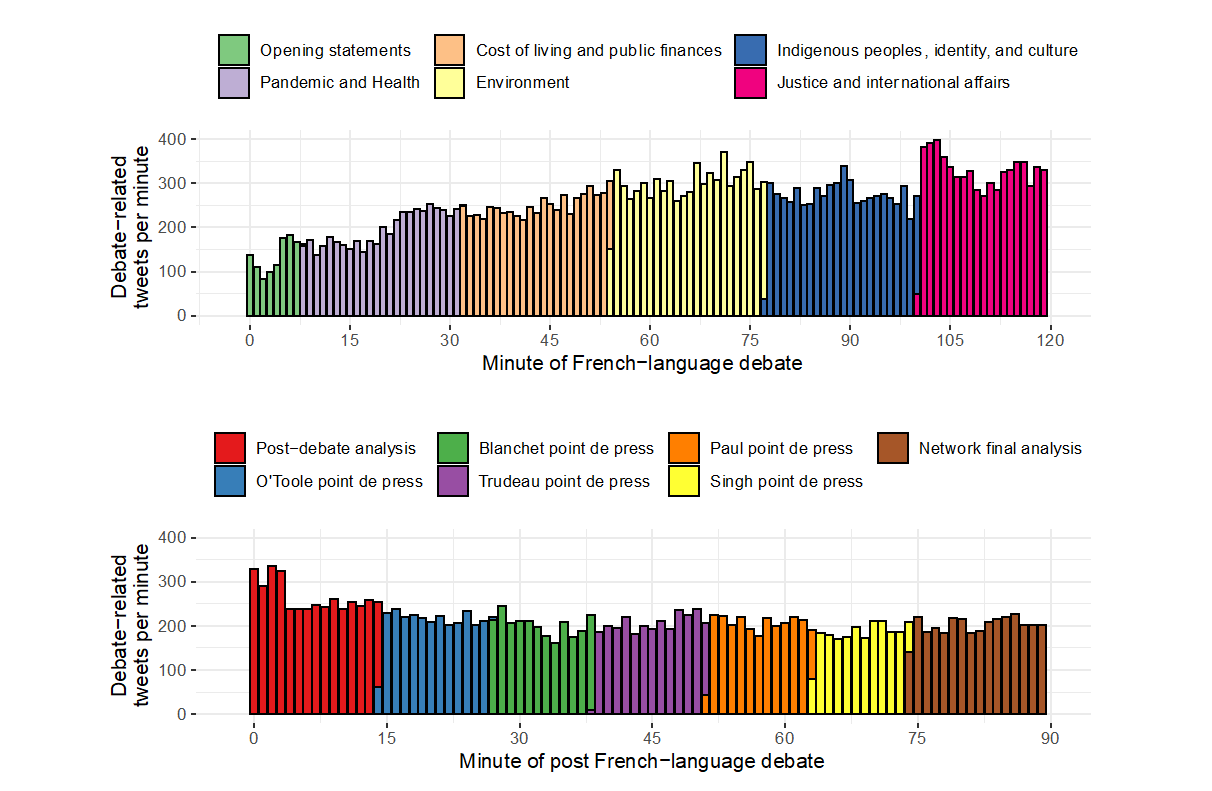
Figure 16 shows the same volumes for the English-language debate and immediate post-debate period. Volume was more steady throughout the debate, but fell off after the debate. Starting the English-language debate at 9 pm Eastern—an hour later than the French-language debate—may have contributed to this drop of interest, with the number of debate-related tweets falling to approximately 250 per minute during the last press conferences of the evening.
4.4.2 Discussion of debates with others
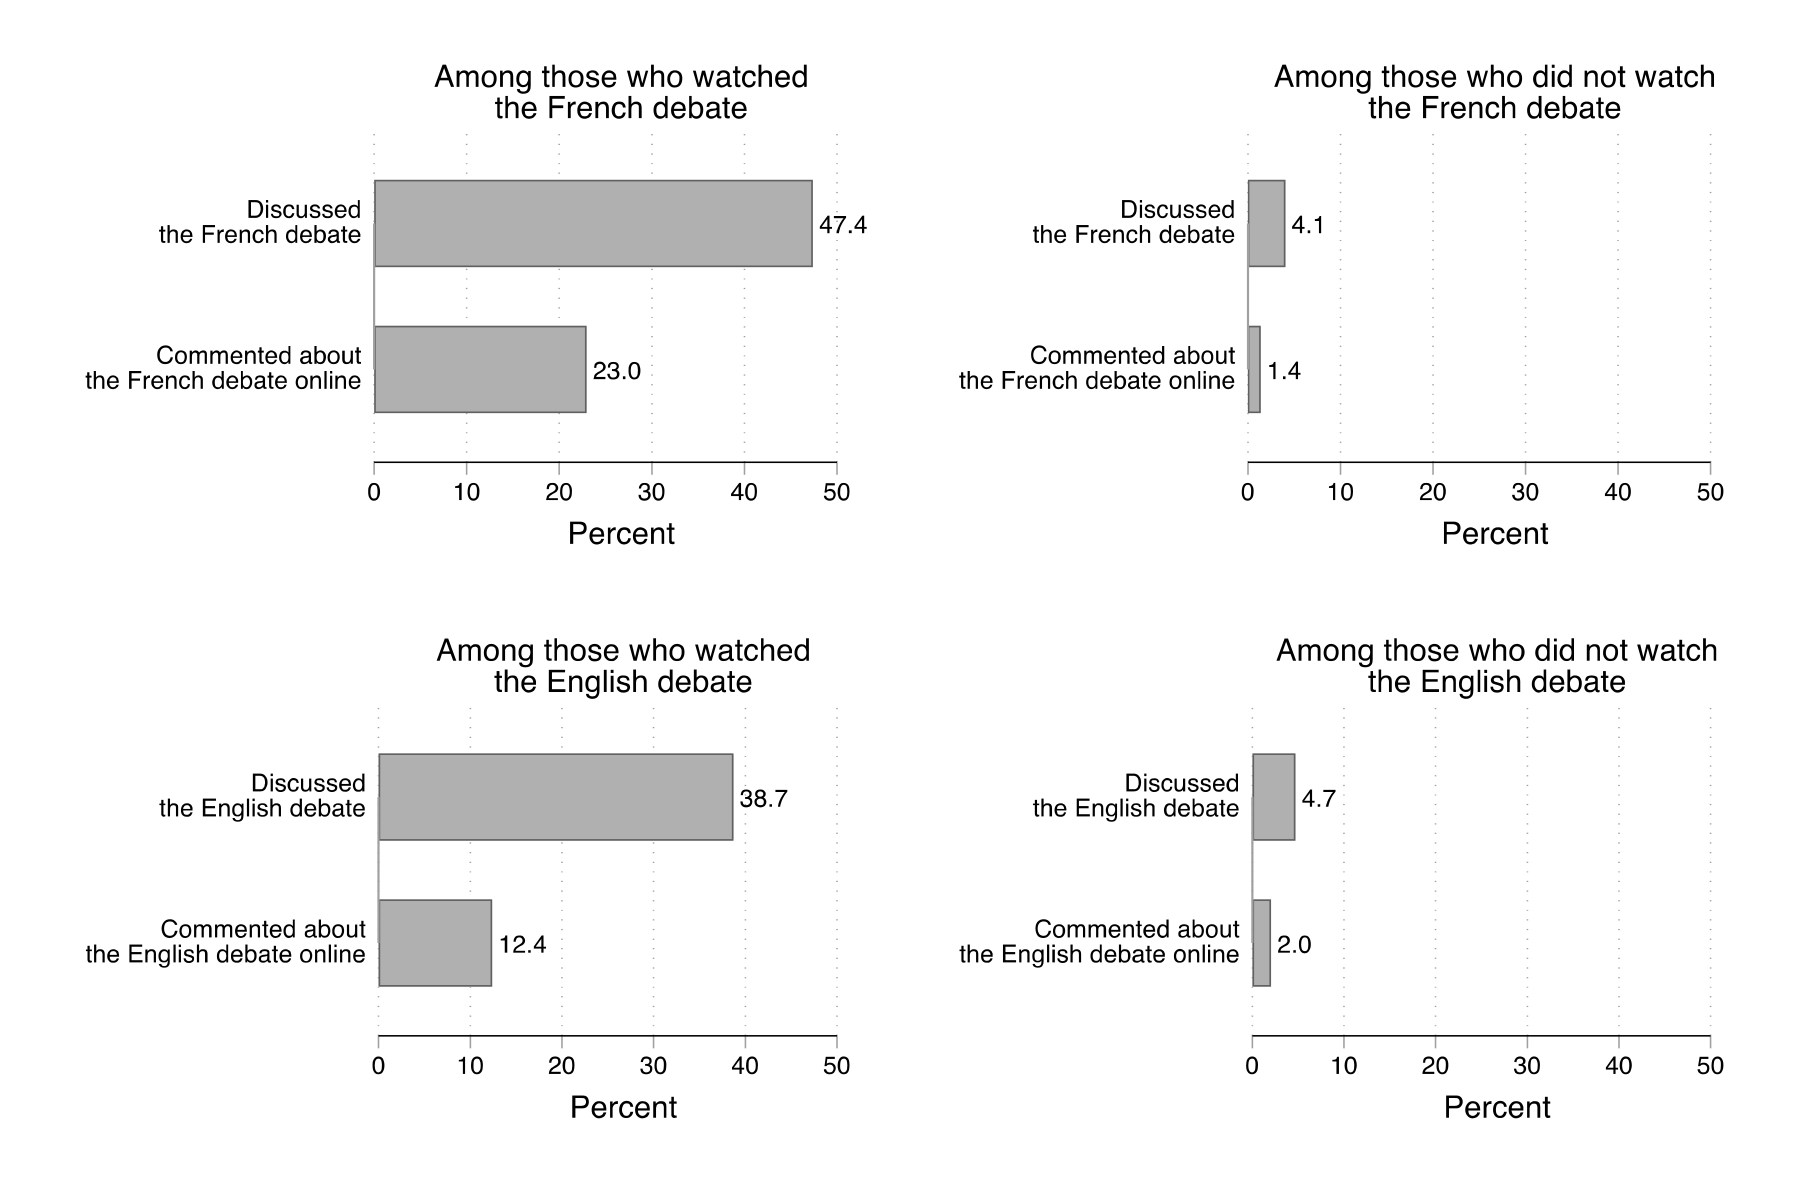
In the second wave of the survey, all participants—regardless of whether they had watched a debate—were asked whether they had discussed what happened in each debate with others. Participants were also asked, again for each debate, whether they commented on social media about what happened in the debate. The results are presented in Figure 17, disaggregated by debate viewership. These results highlight a healthy degree of engagement with the debates after the fact: nearly half (47%) of French debate viewers discussed what happened with others and nearly two in five (39%) of English debate viewers did the same. Online engagement was more modest but still encouraging: 23% of French debate viewers and 12% of English debate viewers commented about the respective debate online. Engagement among nonviewers (right column) is much more limited: less than 5% of non-viewers discussed the debates or commented about them online.
4.5 Evaluations of the debates
4.5.1 Survey-based evaluations
When participants in the second wave reported watching a Commission-organized debate, we followed up with a series of questions meant to elicit their opinions about a wide range of aspects of the debate. Participants were asked to indicate whether they strongly disagreed, somewhat disagreed, somewhat agreed, or strongly agreed with a set of 11 statements about the debate. Figure 18 reports the results for French debate viewers in the form of the percent in agreement with each statement (i.e., combining those who somewhat or strongly agreed).
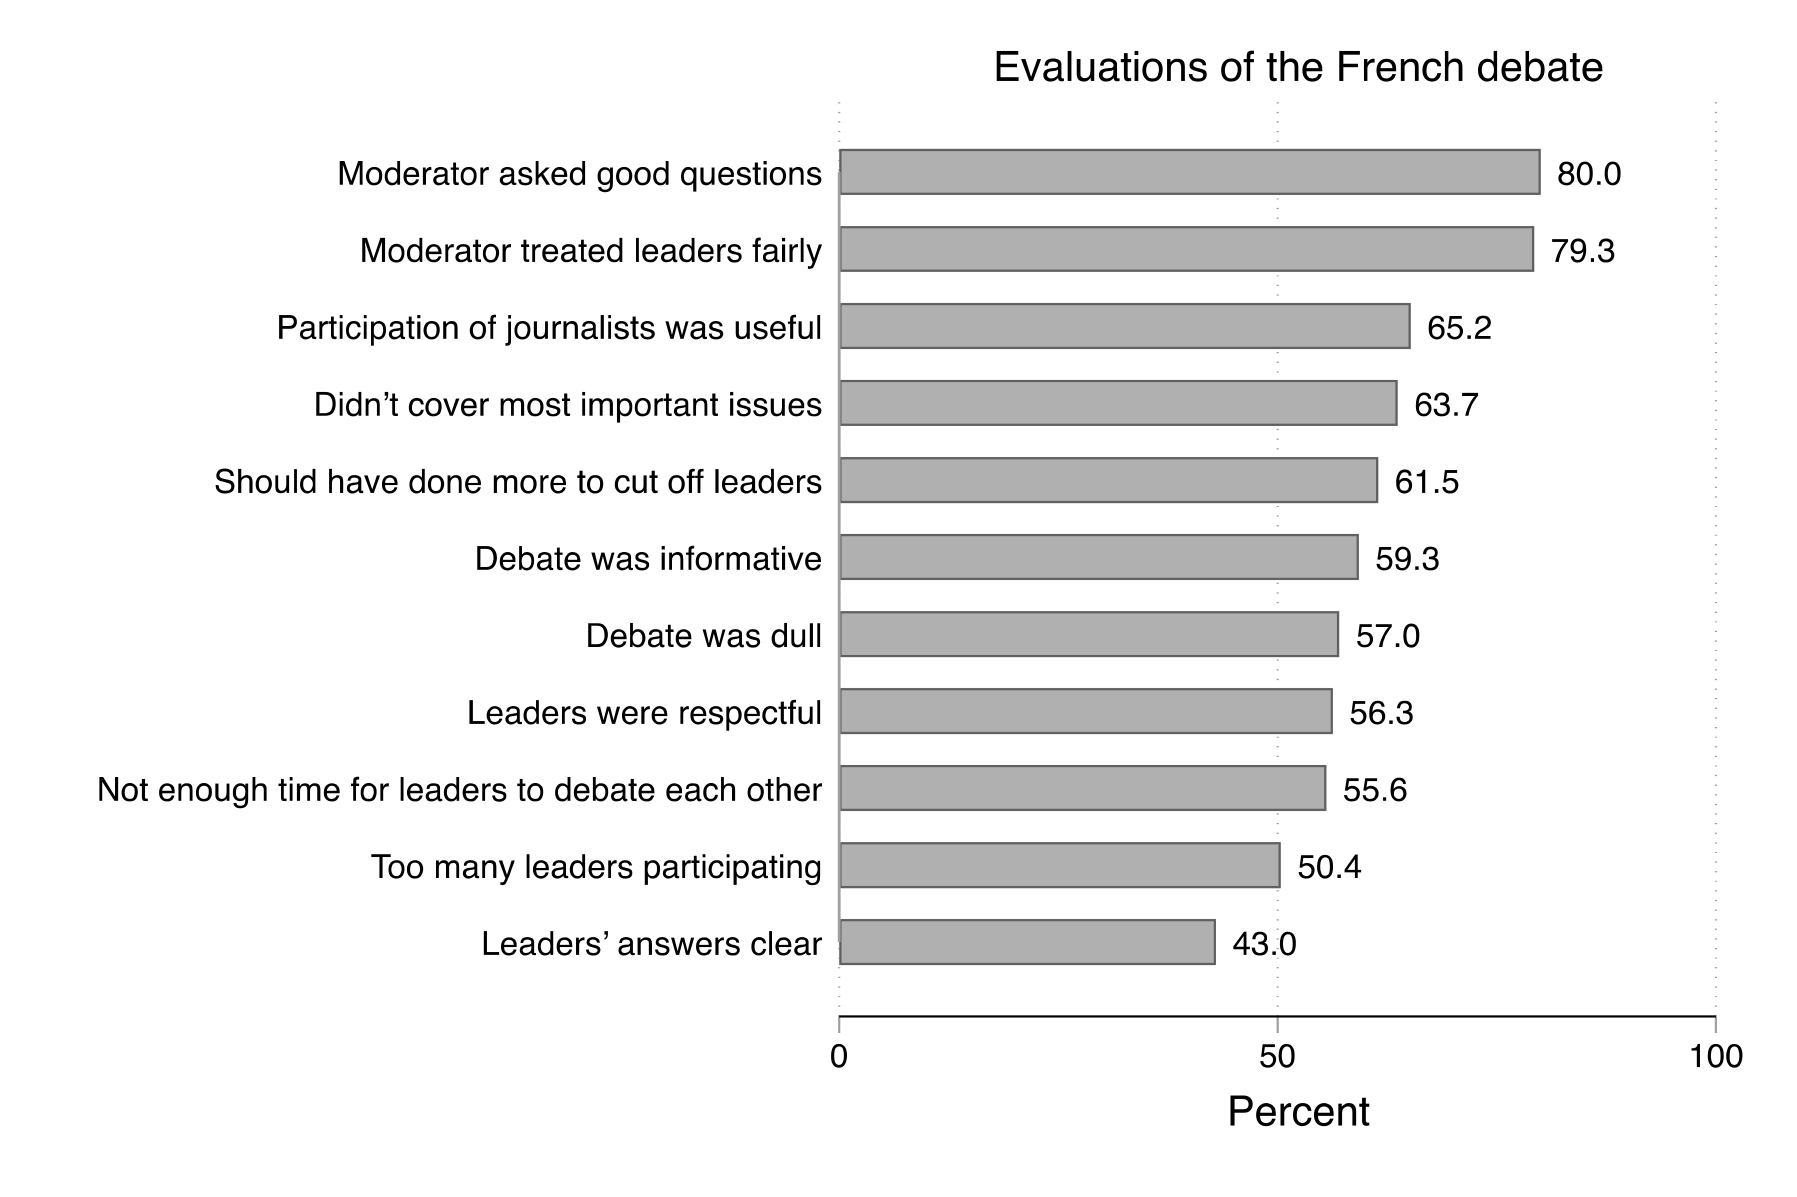
French debate viewers gave generally high marks to the moderator. Large majorities felt that he asked good questions (80%) and treated the leaders fairly (79%). Furthermore, nearly 2 in 3 (65%) French debate viewers thought that the participation of the additional journalists was useful. The chief reservation with respect to the moderation was in terms of managing the leaders' speaking time: 62% said that the moderator "should have done more to cut off leaders when it was warranted" and 56% felt there wasn't enough time for the leaders to "debate each other directly." Managing leaders' speaking time is a thorny issue, one to which we return in Section 4.7. We also note here the recurring frustration that focus group participants experienced when trying to follow exchanges in which leaders talked over each other.
With regards to general judgments of the debate and its format, roughly 3 in 5 (59%) French debate viewers found the debate informative. At the same time, a slightly smaller fraction (57%) characterized the debate as "dull". Fully 64% reported that the debate "didn't cover the issues that were most important" to them. French debate viewers were more evenly split (50%) on another crucial format question—namely whether there were "too many leaders participating in the debate." (We unpack in detail Canadians' preferences with respect to leader participation in Section 4.7).
Lastly, French debate viewers gave the party leaders a mixed scorecard. A majority (56%) found the leaders to be "respectful of each other." Less than half of viewers (43%) felt that leaders' answers were "clear." This maps onto a common concern of focus group participants who, upon viewing clips of the debate, found that leaders' answers lacked detail.
Figure 19 reports the results for English debate viewers. The judgments of English debate viewers mirror those of French debate viewers. Again, top marks are reserved for the moderator and participating journalists. Large majorities believed that the moderator asked good questions (77%) and treated leaders fairly (76%). In addition, over three quarters (76%) of viewers found the participation of the additional journalists useful. Similar to the French debate, however, roughly 3 in 5 viewers (59%) thought that the moderator should have done more to "cut off" leaders—while a majority (57%) felt that the moderator "didn't give the leaders enough time to debate each other directly."
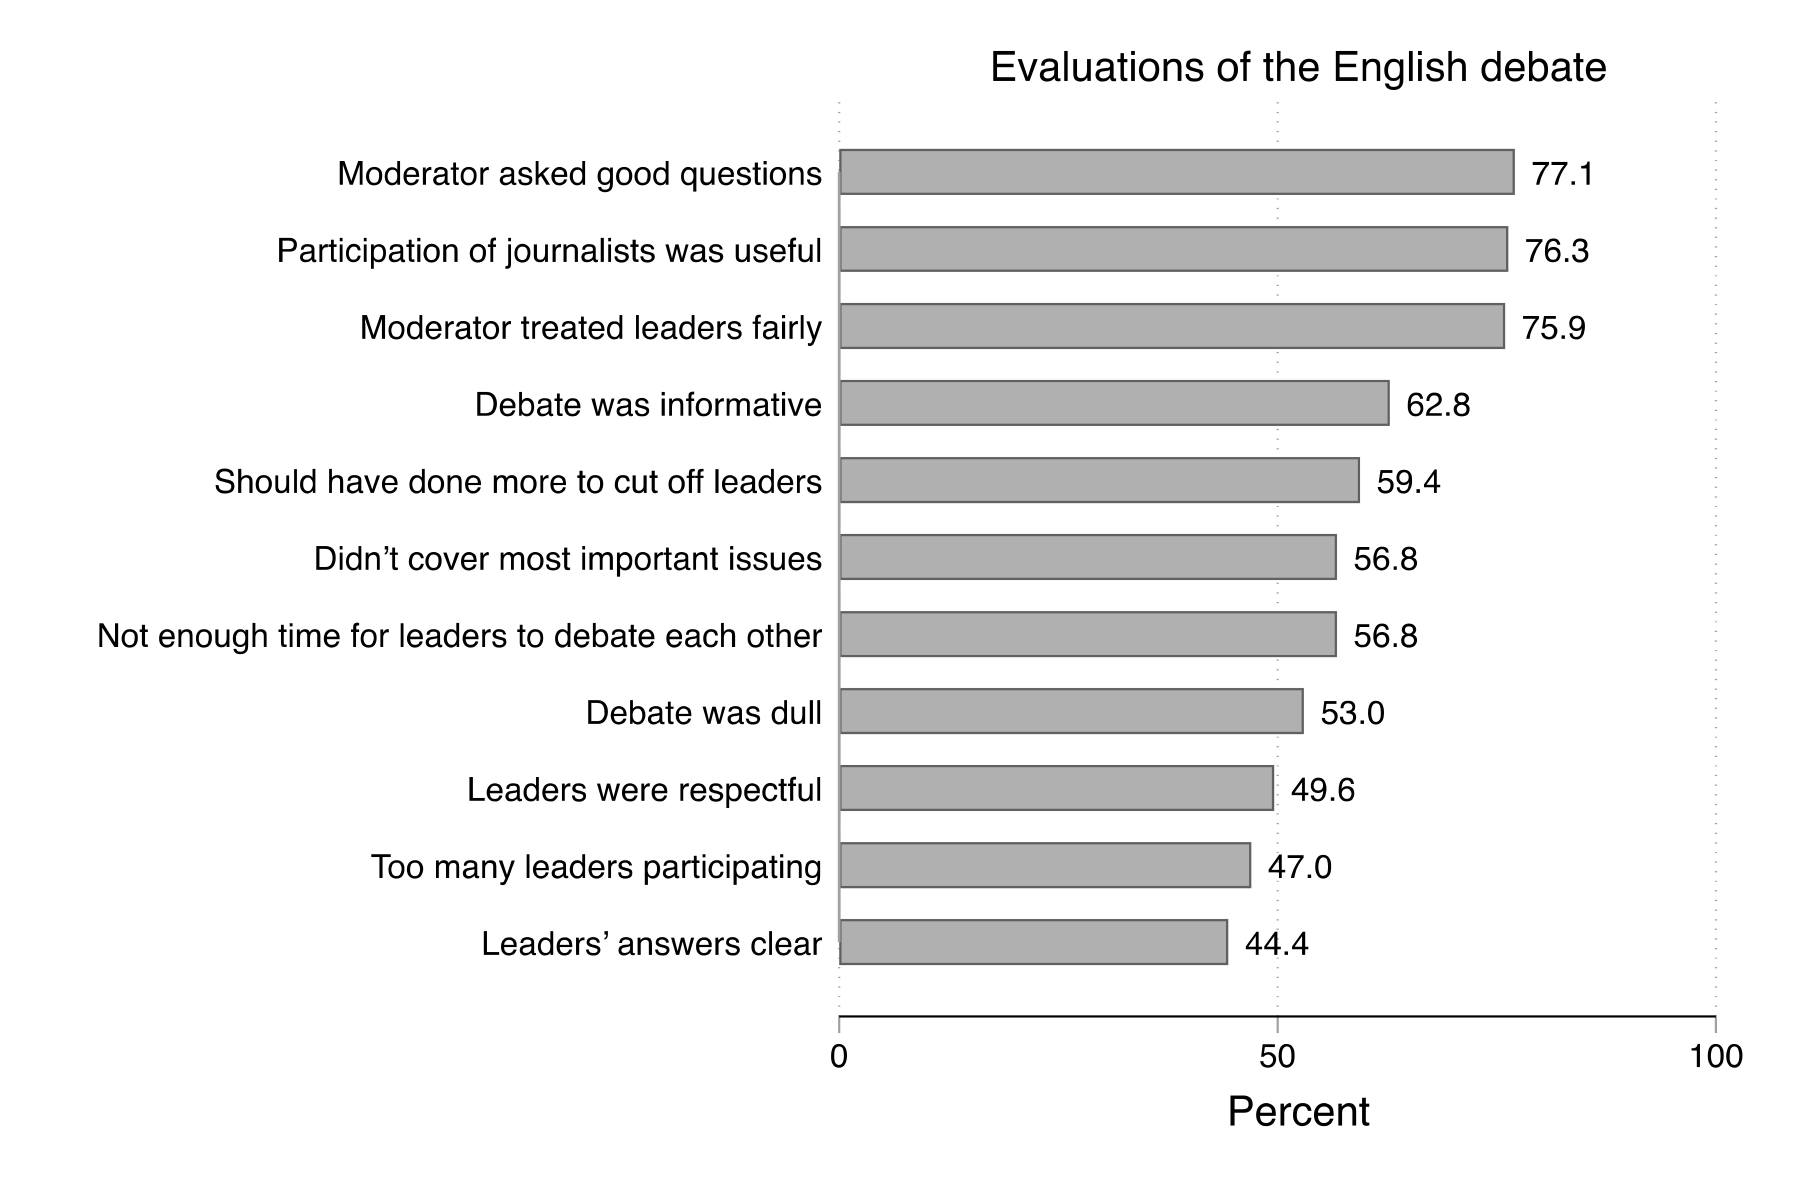
On the debate and its format, 63% of English debate viewers agreed that the debate was "informative." A smaller number (53%) also characterized the debate as "dull." As with the French debate, a majority of viewers (57%) still felt that the debate "didn't cover the issues that were most important" to them. Viewers were split on the question of leader participation—with 47% agreeing with the statement that there were "too many leaders participating in the debate."
The party leaders were also given lukewarm reviews by English debate viewers. Half (50%) characterized their conduct during the debate as "respectful" and under half (44%) characterized their answers as "clear."
To supplement these assessments of specific aspects of the debate, we also asked participants to rate the debates more generally on a scale from 0 to 10, where 0 meant "a very bad debate" and 10 meant "a very good debate." We put this question not only to participants who watched the debate but also to those who did not—provided that they had read, seen, or heard at least some news or commentary about what happened in the debate. Figure 20 reports, for each debate, the average debate rating (on the 0 to 10 scale) for three different types of survey participants: (1) those who watched the debate but did not consume news or commentary about it; (2) those who watched the debate and consumed at least some news or commentary about it; and (3) those who did not watch the debate but did consume at least some news or commentary about it.
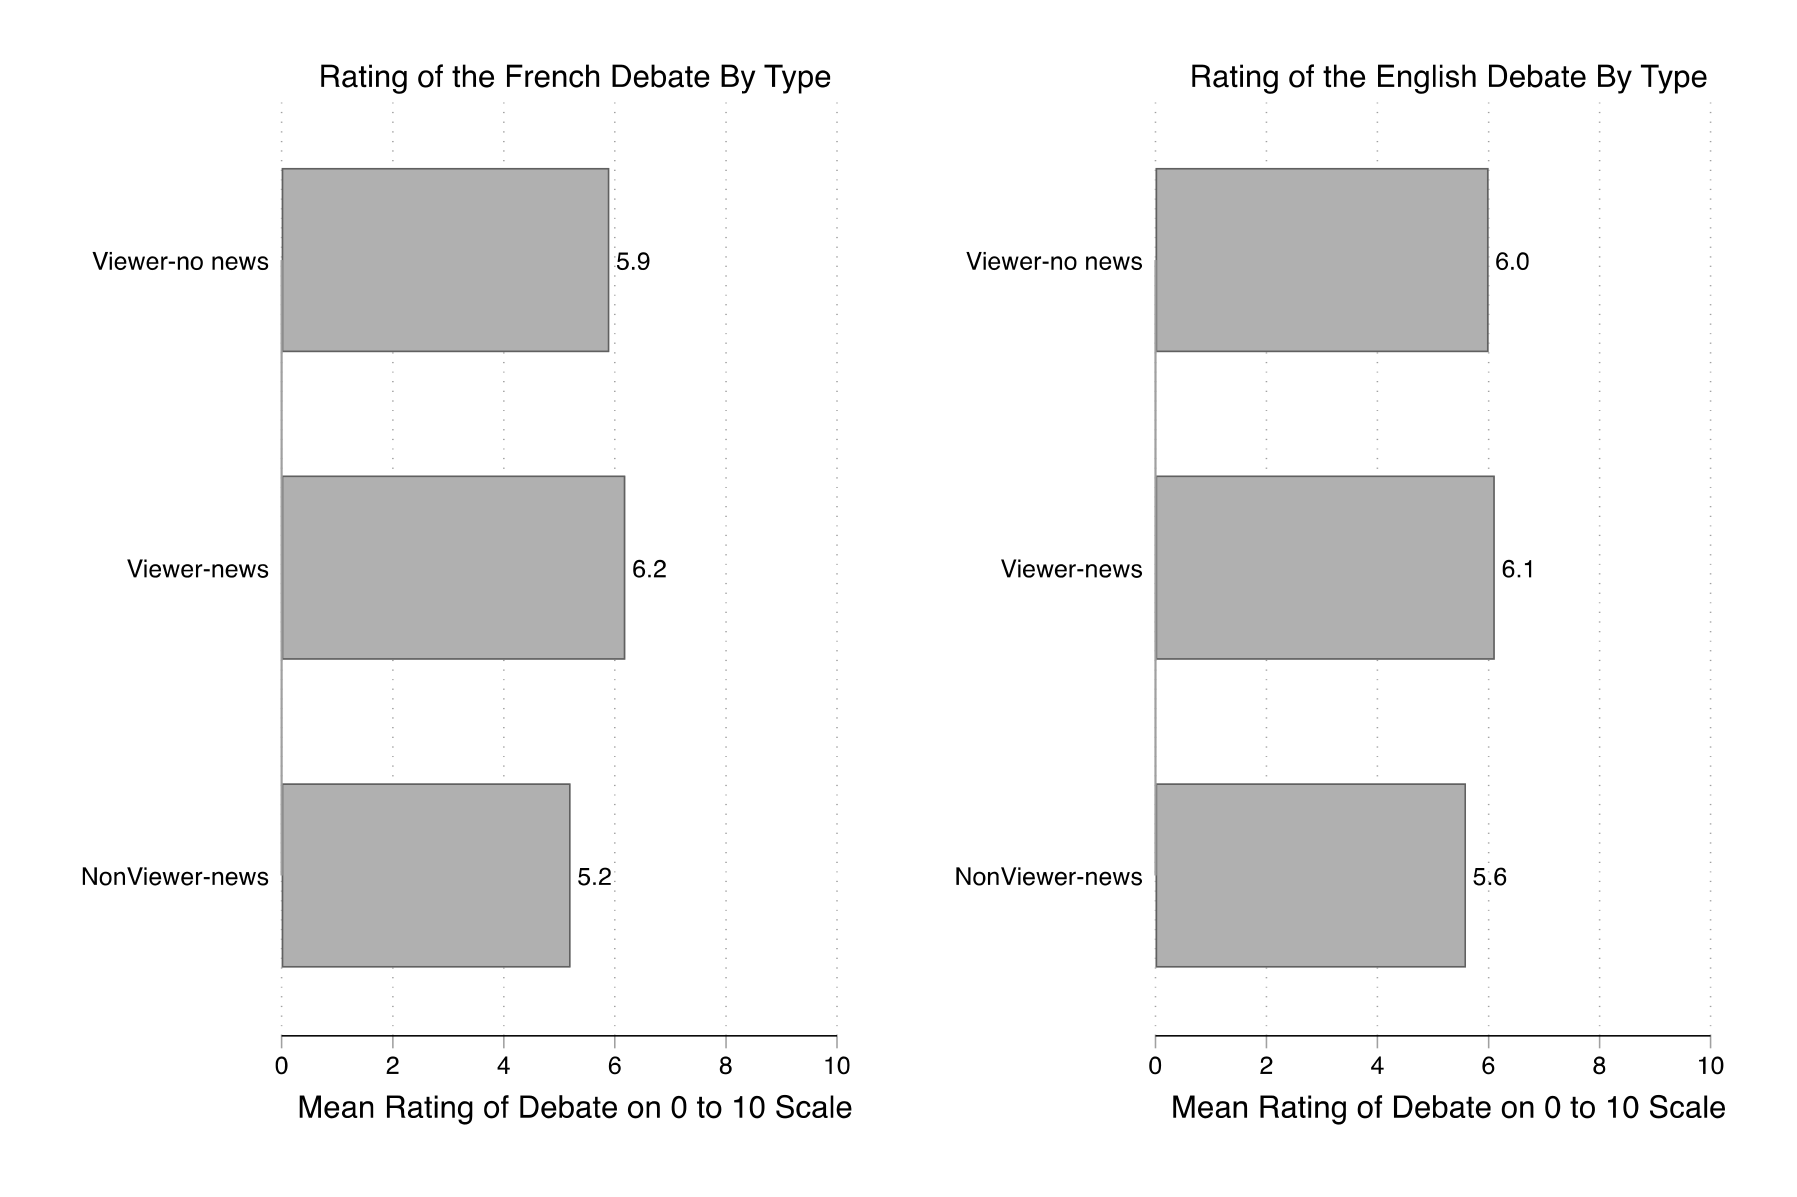
Viewers of each debate typically gave the debate a moderately positive rating—with the average rating hovering near 6 on the 0 to 10 scale. Participants who did not see the debate but did consume news or commentary had a somewhat less favourable assessment. Indeed, in the case of both the French and English debates, debate viewers who consumed news had a statistically significantly more positive assessment than non-viewers who consumed news (debate viewers who consumed no news about the debate constituted only a small fraction of the sample and thus their average rating should be interpreted with caution). While this finding is only suggestive, the difference in assessments between viewers and nonviewers implies that the act of actually watching a debate—rather than merely consuming news or commentary about it after the fact—may be associated with more favourable views of the debate.
4.5.2 Twitter-based evaluations
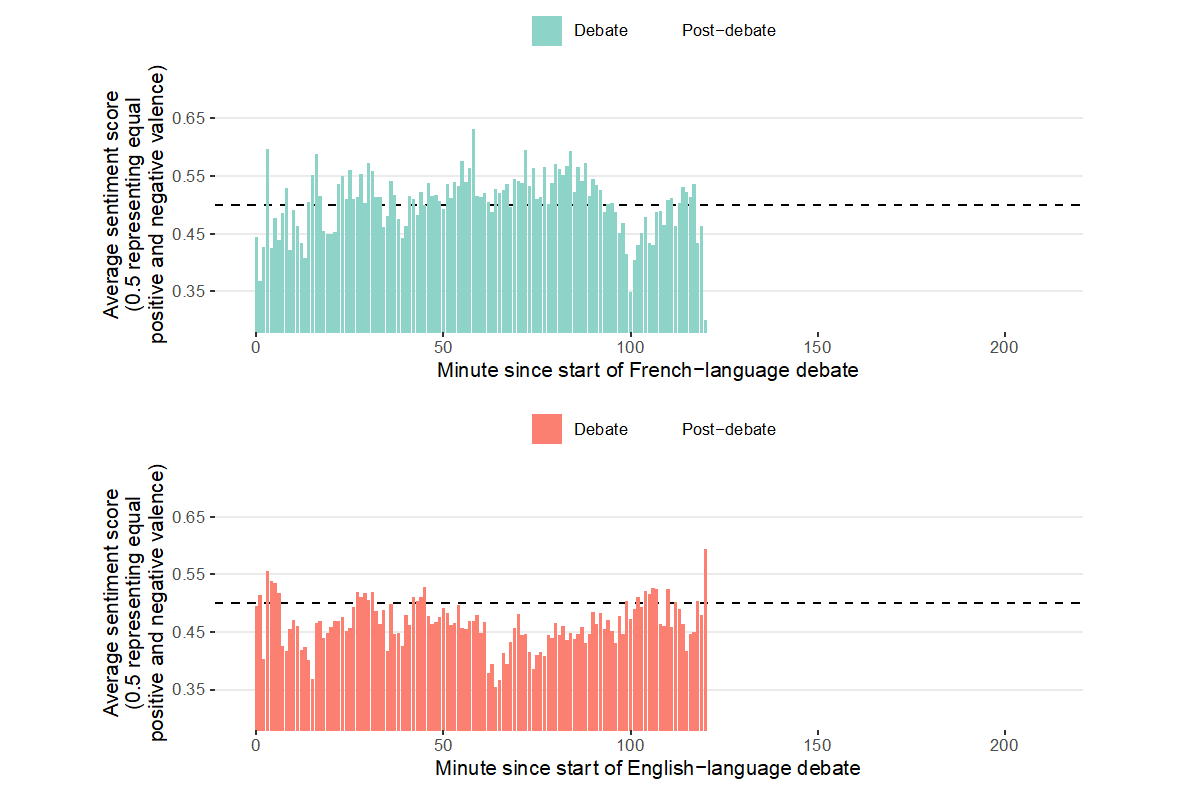
Next, we turn to a sentiment-based analysis of the Twitter conversation during and in the immediate aftermath of the debates. Figure 21 shows the overall sentiment of tweets related to both the French-language debate (top panel) and English-language debate (bottom panel). Sentiment related to both remained close to the neutral position (0.5), with the most noticeable trend being a more negative sentiment in the tweets in the post-French language debate.
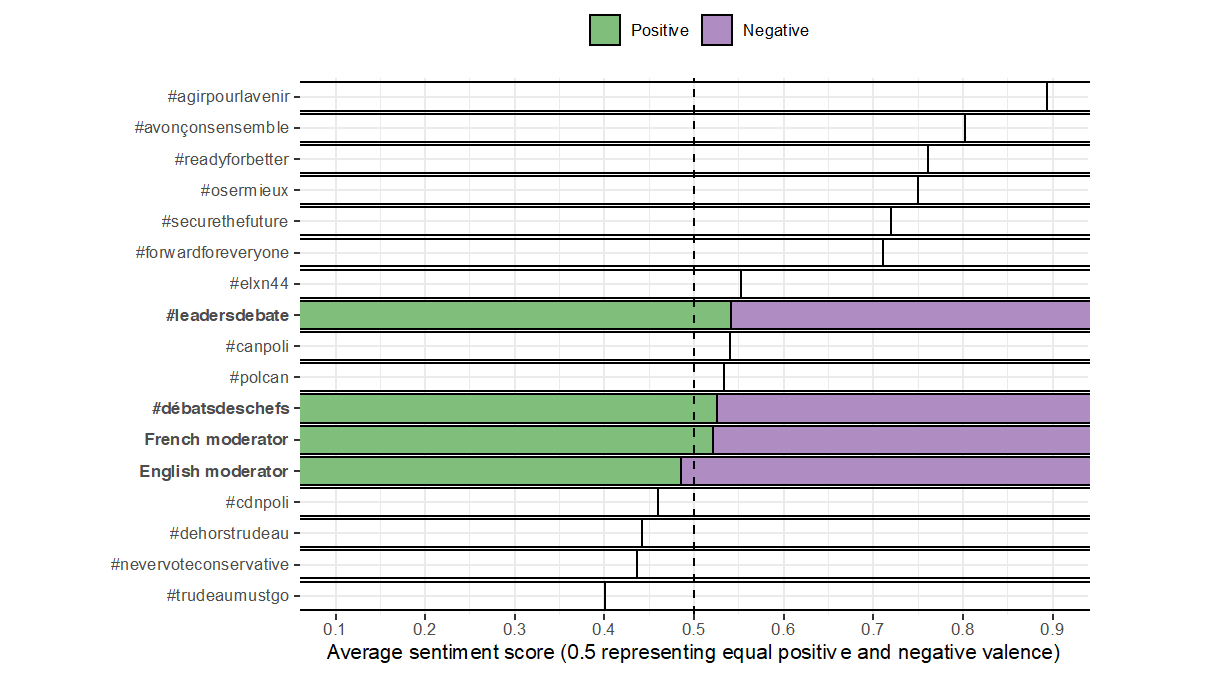
We use a similar sentiment methodology to examine specific themes of discussion. Figure 22 shows overall sentiment for a variety of election-related hashtags, as well as for mentions of the debate moderators. The sentiment dictionary employed here correctly identifies positive and negative hashtags, with anti-Trudeau and anti-Conservative Party hashtags having overall negative sentiment and pro-Liberal, pro-Conservative, and pro-NDP hashtags having overall positive sentiment. The debate-related themes are those with the darkest bars and they fall between the pro- and anti-hashtags, with overall sentiment at approximately 0.5—a neutral position. Tweets mentioning the moderator of the French-language debate were somewhat more positive than the moderator of the English-language debate, although the English-language debate hashtag was slightly more positive than the French-language one.
4.6 The impact of watching the debates
In this section, we explore the impact of watching the debates on a wide variety of political outcomes—from engagement to knowledge to behaviour. We did this by recontacting a portion of participants from the Wave 1 pre-debate survey and administering the same set of questions in the Wave 2 post-debate survey. In this way, we can compute the within-individual differences, if any, in these outcomes. Moreover, by comparing these within-individual differences between those who did—and did not—watch a debate, we gain important leverage on the question of how watching the debates impacted these various outcomes. Details on the methodology used to estimate debate impacts can be found in Section 3.1.1.
4.6.1 On political engagement
We begin by exploring the impact of debate watching on six outcomes designed to capture engagement with the election and with politics more generally. Figure 23 reports, for each of the six outcomes, the model predictions for those who watched at least one Commission-organized debate and for those who did not watch any Commission-organized debates—along with the 95% confidence intervals associated with each model prediction.
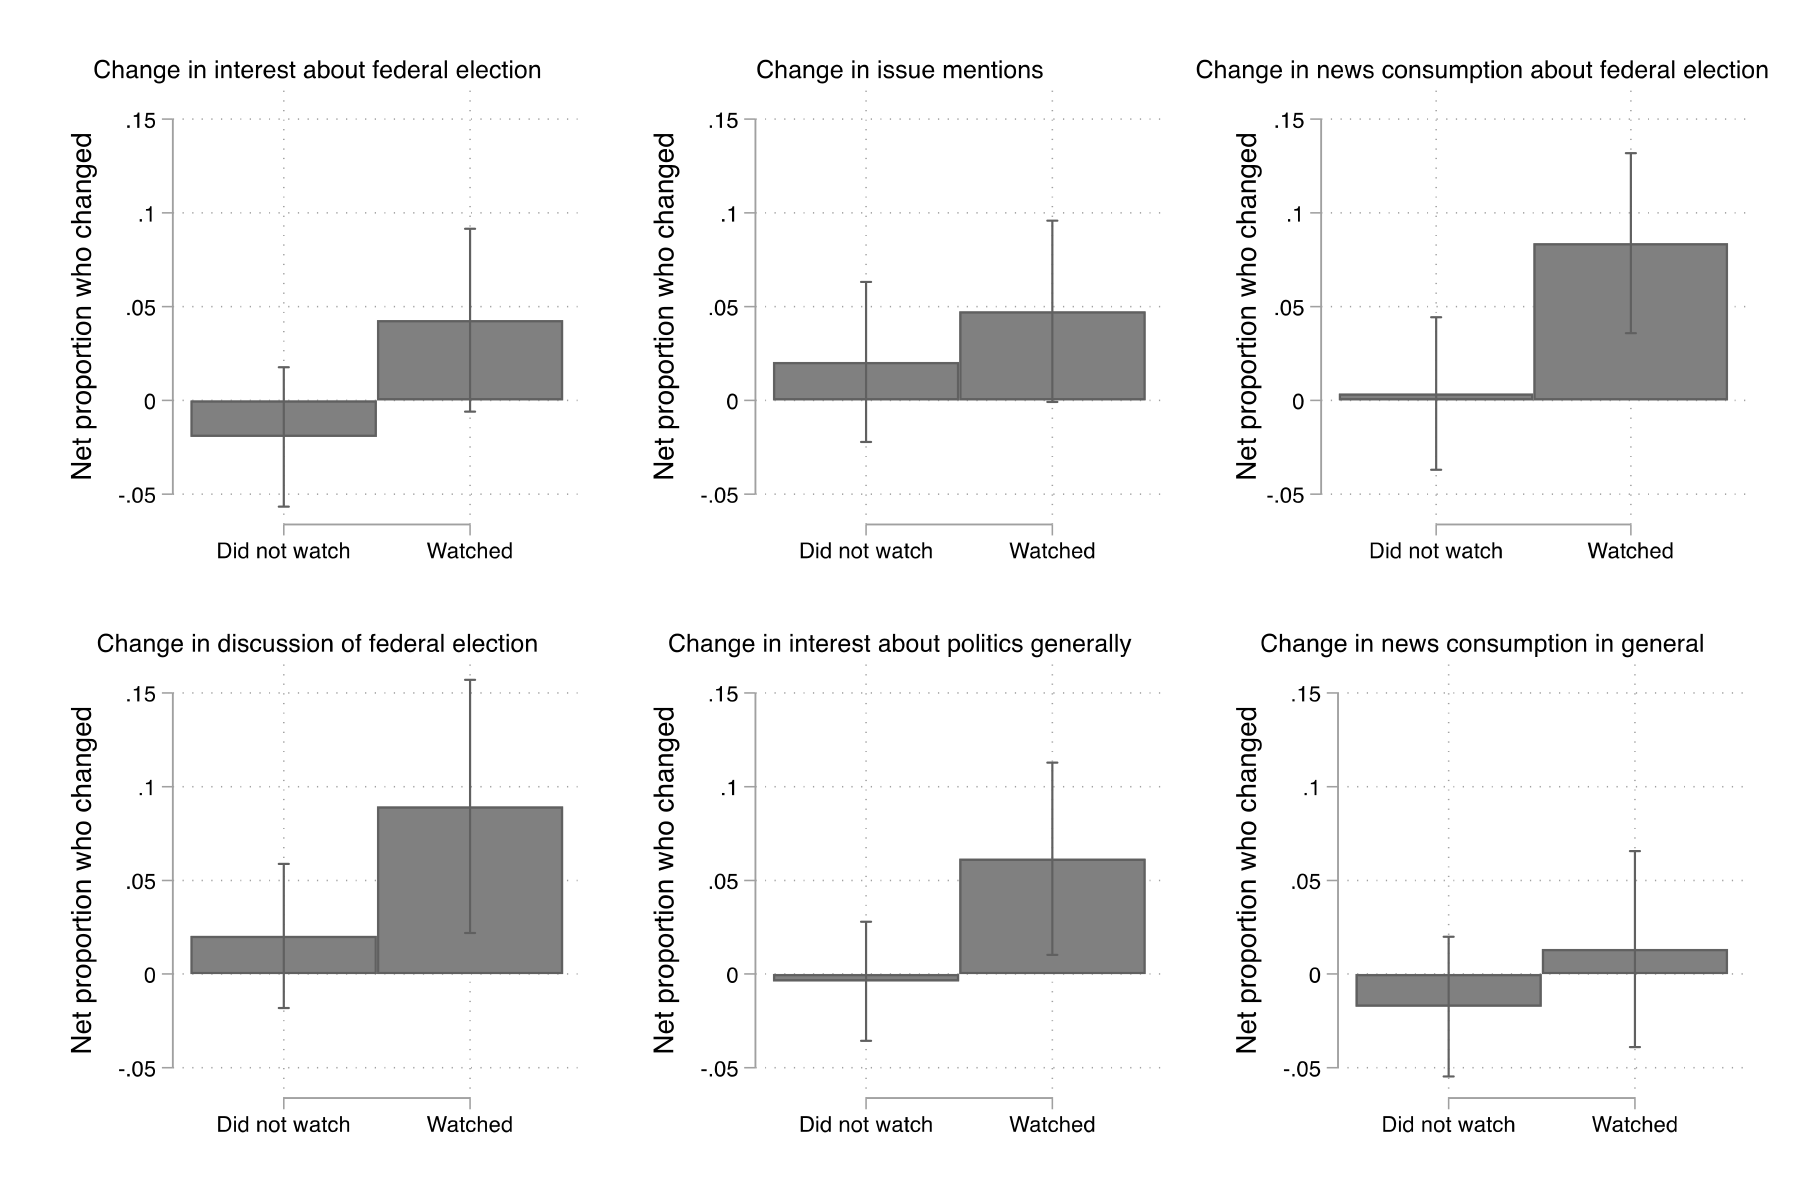
We make three findings. First, watching a debate was associated with an increase in interest in the federal election. Compared to individuals who did not watch, those who watched a debate had a 6 percentage point greater net increase in self-reported election interest. Second, debate watching was associated with an increase in the consumption of news about the federal election. Those who watched a debate had an 8 percentage point greater net increase in self-reported election news consumption than those who did not watch. Third, debate watching sparked greater interest in politics more generally. Compared to non-watchers, the debate watchers experienced a 6 percentage point net increase in self-reported general political interest. Furthermore, debate watching appears to have also contributed to greater discussion of the federal election—although the difference between watchers and non-watchers only approaches the conventional level of statistical significance (p = .08).
We did not find statistically significant evidence that debate watching was associated with more frequent "issue mentions" (i.e., listing more issues of interest in the election) or a greater volume of news consumption generally. On balance, these findings suggest that the debates did succeed in stimulating greater political engagement among those who watched them.
4.6.2 On political knowledge
Next, we turn to the question of whether watching a debate led to greater political knowledge. In Figure 24, we examine this from three prospectives. First, we investigated knowledge of party promises. Participants were given a set of 10 campaign promises (two for each of the parties participating in the Commission-organized debates) and were asked to identify which party, if any, made the promise. Second, we explored knowledge of current economic and social conditions with a series of four factual questions about the federal deficit, the unemployment rate, greenhouse gas emissions, and home prices. Third, we investigated participants' self-reported confidence that they knew "enough to make a good voting decision" in the election.

We find no evidence that the debate had an impact on these three knowledge outcomes. While watching a debate, for example, is associated with a net increase in knowledge of current conditions, the difference between watchers and non-watchers is not statistically significant. One possible explanation for the absence of debate impacts here is that the debates did not elicit the kind of factual information that was designed to be tapped by the party promise questions or the economic and social condition questions. Furthermore, many participants already self-reported relatively high confidence in their ability to make a good voting decision.
Next, we dig further into participants' political knowledge by assessing their ability—or willingness—to evaluate the parties and their leaders. To do so, we constructed four outcomes. First, we built an index of participants' ability to rate key traits of each of the five participating party leaders. Participants could indicate yes, no, or unsure in each instance. This index counted the number of instances in which a participant gave either a yes or no answer—that is, when they did not answer unsure. Second, we constructed an index to capture participants' ability to rate all five participating leaders on a 0-100 feeling thermometer scale. Here participants could rate each leader or indicate that they "Don't know the leader." We thus computed, for each participant, whether or not they rated all five leaders. Third, we constructed an index of participants' ability to rate the five participating parties on a 0 to 100 feeling thermometer scale. Similar to the leader feeling thermometers, the party feeling thermometers allowed participants to either give a score or to tick "Don't know / Prefer not to answer." Thus, we computed—again for each participant—whether or not they rated all five parties. Fourth, we conducted a similar exercise with respect to participants' ability to place all five parties along the conventional left-right spectrum of political ideology. Here again participants had the option of ticking "unsure" for each party. We computed whether participants placed all five parties along this left-right continuum.
Figure 25 reports the model predictions for the change in each of these four indexes—again for both watchers and non-watchers. We find that debate watching had a statistically significant positive impact on the ability to rate all five leaders using the 0 to 100 feeling thermometer. More specifically, those who watched a debate experienced a 9 percentage point greater increase in net ability to rate the favourability of the leaders—compared to those who did not watch. We do not find statistically significant differences with respect to the other three indexes: the ability to evaluate leaders' traits, the ability to rate the favourability of all five parties, or the ability to place all five parties along the left-right ideological spectrum.

In sum, our analysis did not find debate impacts in the form of knowledge of party promises or factual knowledge about current conditions—nor with respect to participants' ability to rate or situate the parties. We did, however, find some evidence that debate watching led to participant learning about the party leaders: specifically, debate watchers were better able than non-watchers to rate their favourability toward all five participating party leaders. This greater familiarity with the party leaders is notable in that prior research shows that leader evaluations are an important ingredient in voting behaviour. Thus, in our judgment, the question is not whether debates contributed to greater political knowledge: we find that they do. Rather, the question is how best to optimize learning. For example, how can debates be designed in ways to provide the most useful information to Canadians in a short period of time? We turn in Section 4.7 to examining how Canadians' preferences for various debate formats could inform such a design.
4.6.3 On political evaluations
Next, we investigate the influence of debates on citizens' assessments of the leaders and their parties. This serves as a companion to the preceding exploration of Canadians' ability/willingness to rate and place the leaders and their parties. Here we construct four outcome measures. The first three simply capture the within-individual changes in ratings and placements conditional on giving a rating or placement. More specifically, for each participant, we computed (1) the mean absolute difference across the five leader feeling thermometers; (2) the mean absolute difference across the five party feeling thermometers; and (3) the mean absolute difference across the five party left-right ideological placement scales. The fourth measure captures participants' belief about which party was "best at addressing" what they considered to be the most important issue in the election. The measure is thus a simple binary indicator of whether a participant selected a different party in the post-debate second wave than they did in the pre-debate first wave. In short, the four measures capture the degree to which Canadians changed their views of the leaders and parties—without specifying the direction of that change. The results are compiled in Figure 26.
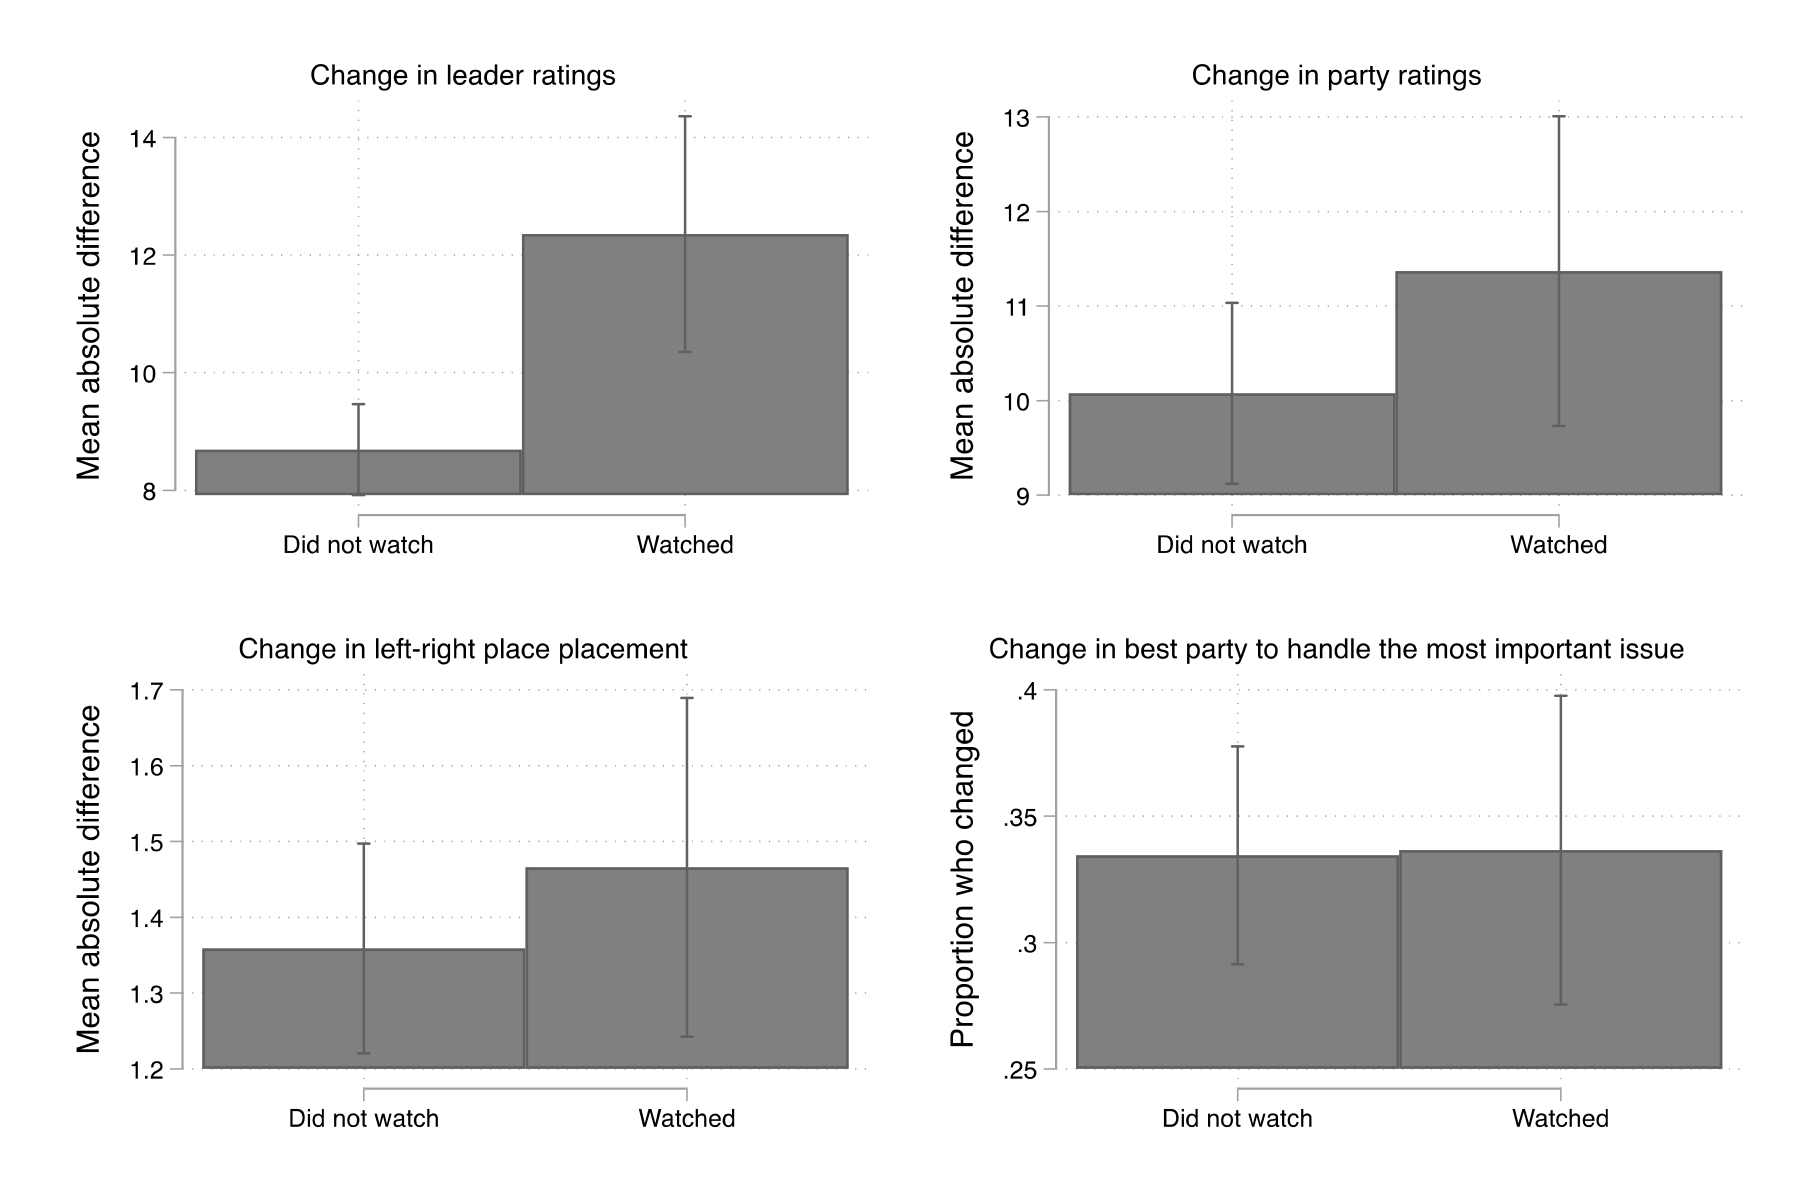
We find that debate viewership contributed to greater change in the leader feeling thermometer ratings. The typical non-watcher updated their mean rating of the leaders by 9 points (recall that the original rating scale was 0 to 100). By contrast, the typical watcher updated their mean leader rating by 12 points, a statistically significant difference. We do not find statistically significant differences between watchers and non-watchers for the other three measures: namely, with respect to party ratings, party left-right ideological placements, or the party believed to best handle the most important issue.
4.6.4 On institutional evaluations
Turning to institutional evaluations, we examine the possible impacts of the debates on participants' self-reported political efficacy and satisfaction with Canadian democracy—as well as the degree to which they trust key political institutions like the courts, the federal government, the media, and political parties.
The results are reported in Figure 27. We find evidence that the debates had a positive impact on trust in the federal government. Compared to those who did not watch, debate watchers experienced a 10 percentage point greater net increase in trust in the federal government. We also find some evidence of greater increases in trust in the media and trust in political parties among watchers—again relative to non-watchers—though this difference only approaches the conventional level of statistical significance (in the case of both outcomes, p = .07). We do not find evidence that debate watching contributed to increases in political efficacy, satisfaction with Canadian democracy, or trust in the courts.
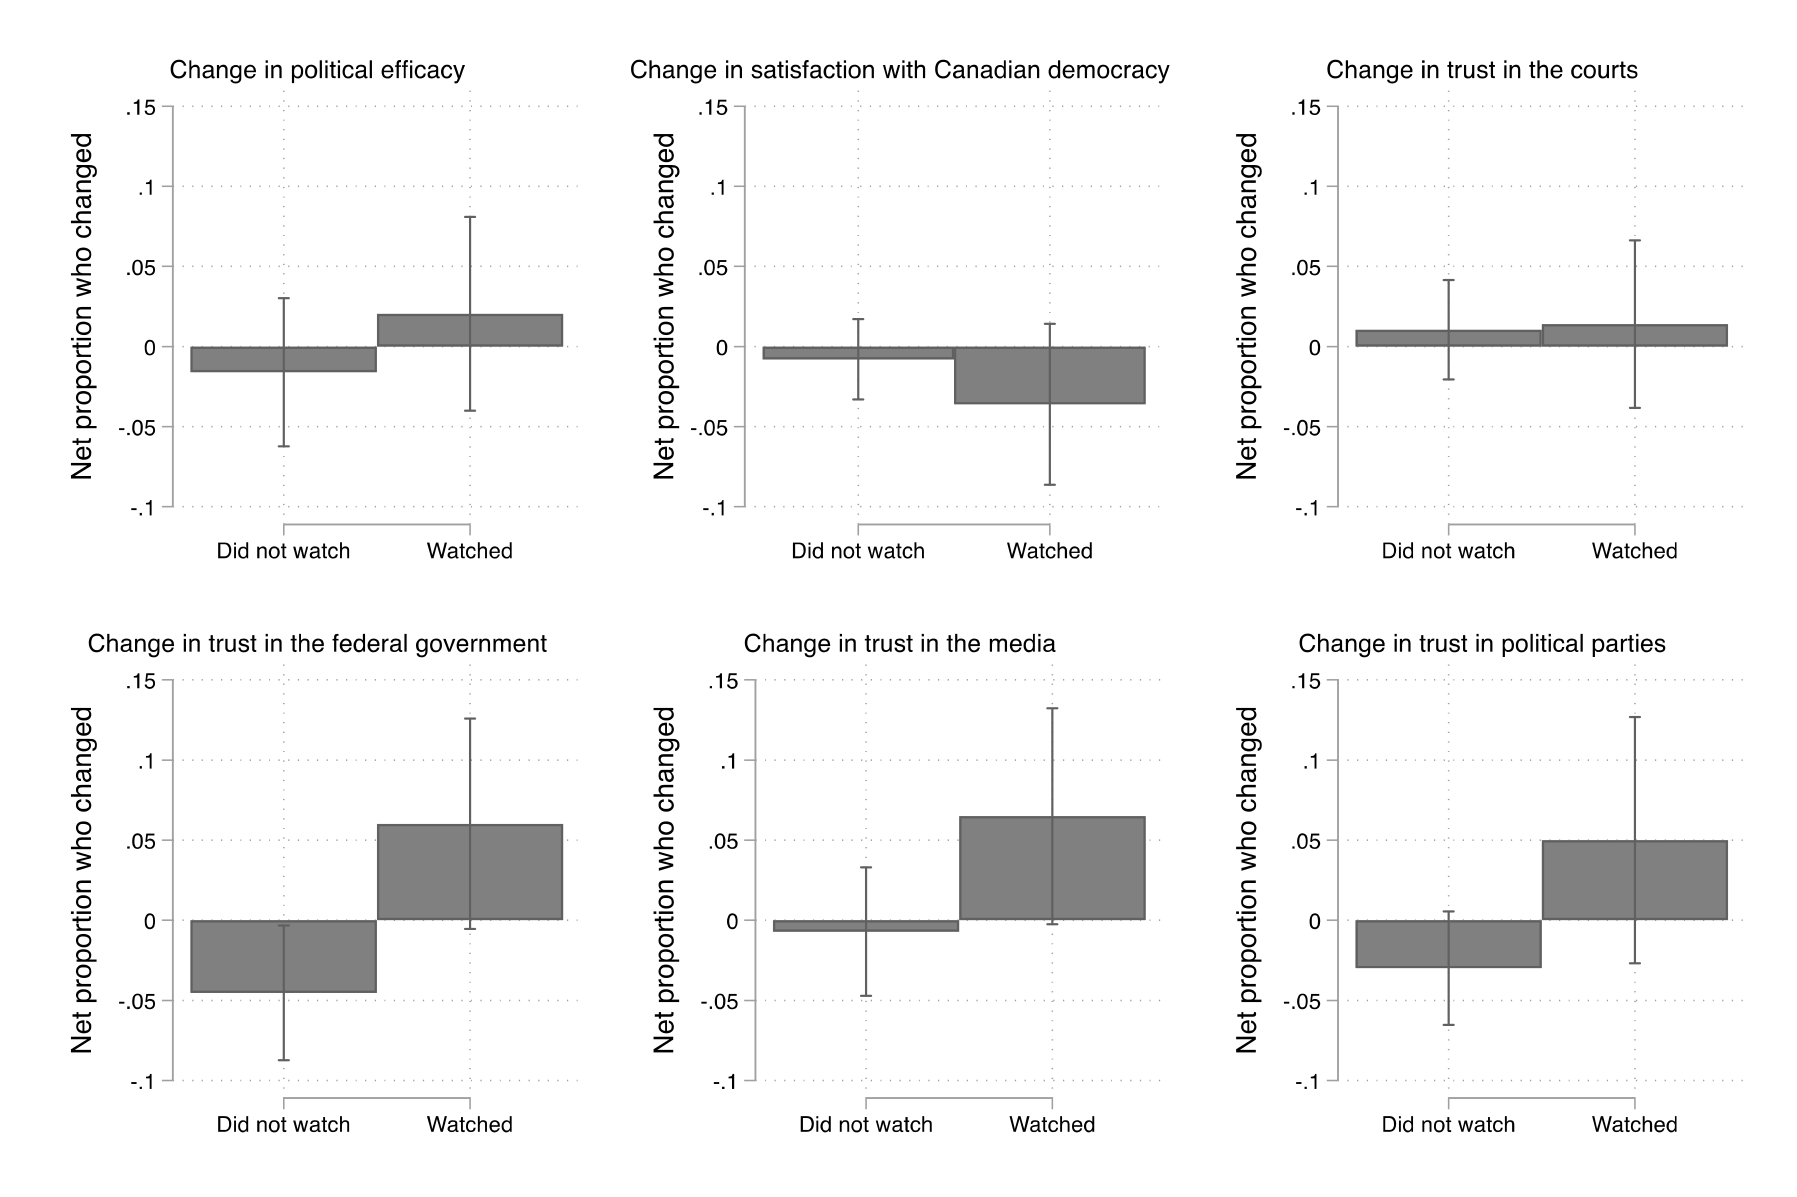
The fact that debate watching contributed to increased trust in the federal government, and possibly also to increased trust in the media and political parties, is notable and worth considering further. Indeed, one would not necessarily expect that exposure to the often combative and partisan atmosphere of a debate would build public trust. One possible explanation, however, is that seeing the leaders, including the prime minister, subject to questioning and compelled to explain themselves serves to engender greater trust. Future research should go deeper on this question of trust, exploring what particular features of debates help build Canadians' confidence in their political institutions.
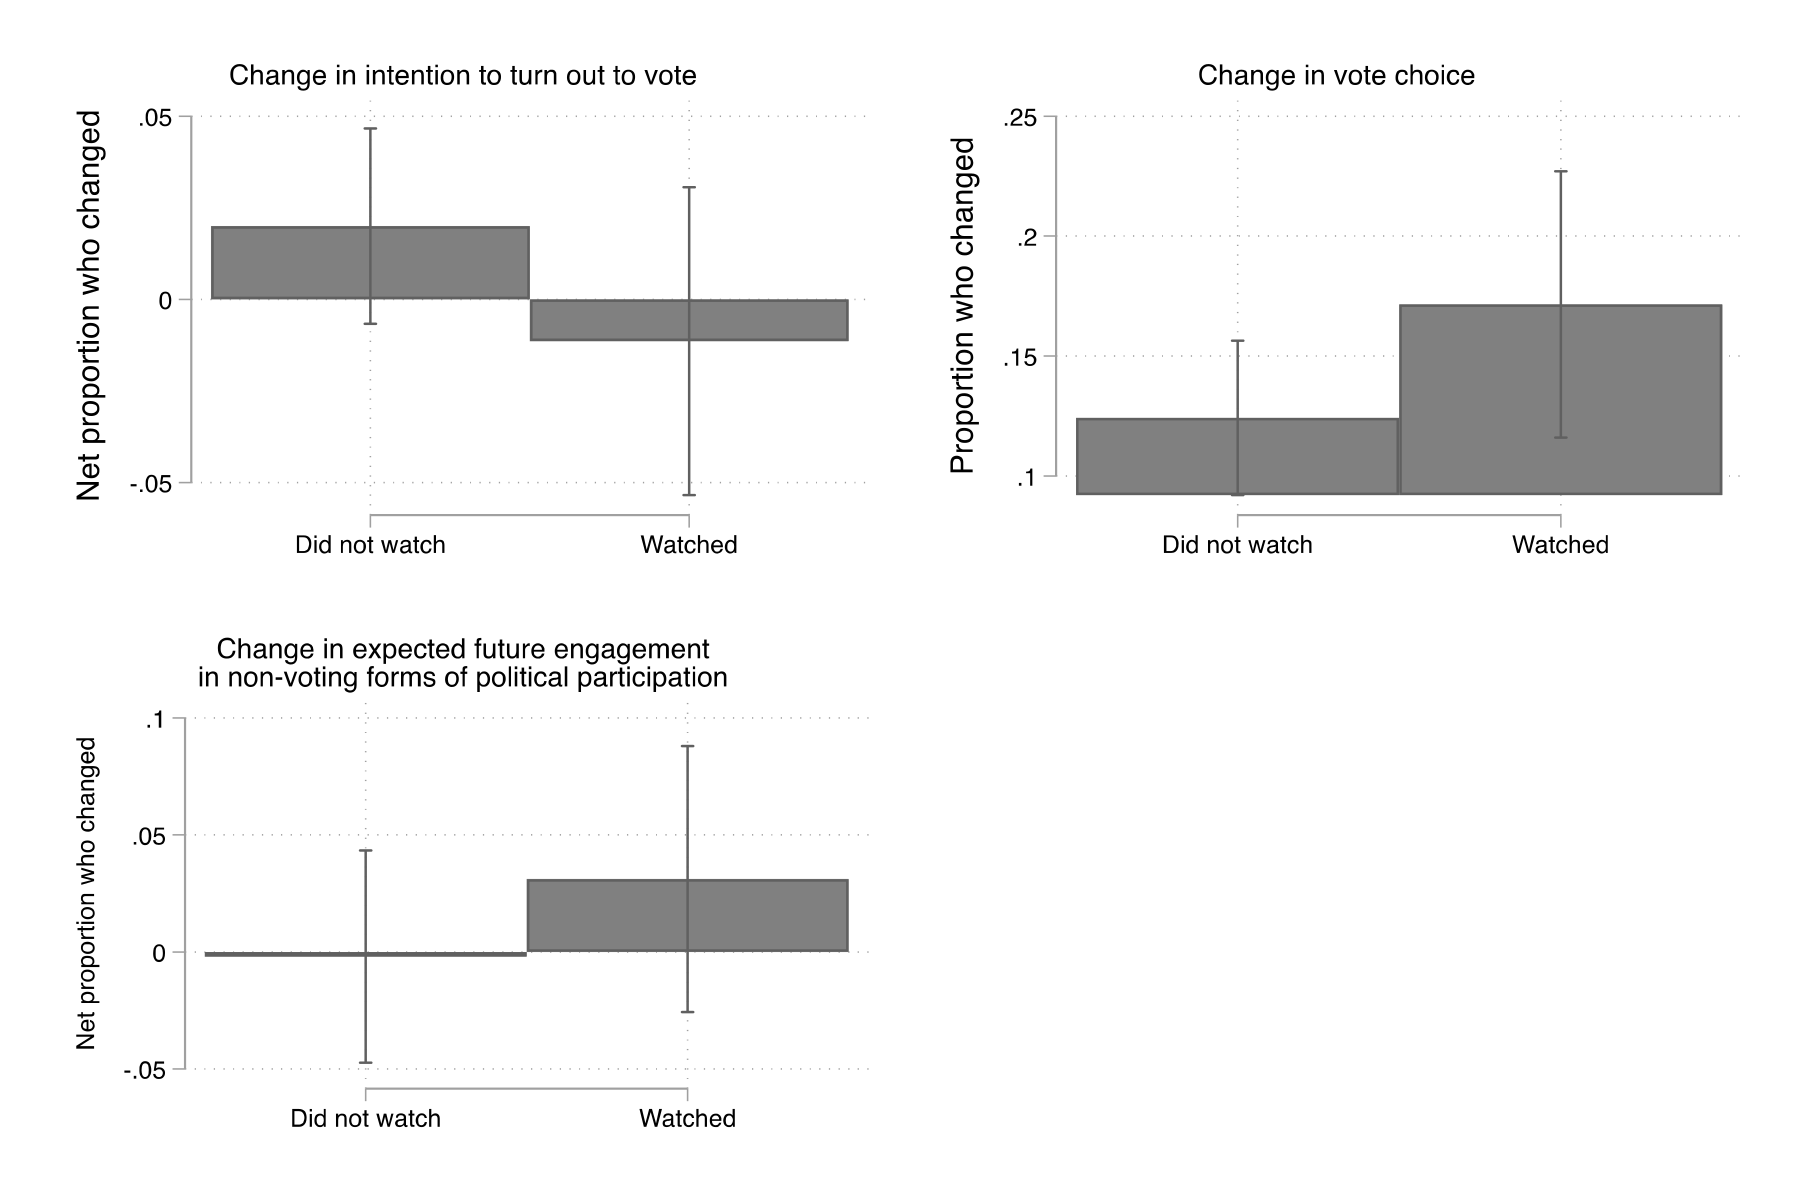
4.6.5 On political behaviour
The last set of outcomes we explore concern political behaviour—specifically in terms of 2021 turnout intention and vote choice, as well as participants' expectations about their future non-voting forms of political participation. These are reported in Figure 28. We do not find evidence that debate watching was associated with changes in these behaviours at conventional levels of statistical significance.
4.7 Public preferences for future debates
In this section, we turn to investigating Canadians' preferences for future debates. To estimate these preferences, we administered a third survey to a fresh cross-section of just under 500 Canadians. The survey elicited views across a wide range of issues—ranging from who should participate in the debates to how the debates should be moderated to the appeal of various different types of debates and public events. These preferences were gauged in a variety of ways: for example, by asking participants to rank their goals, to make trade-offs between debate formats, and to allocate a time budget within a given debate. What emerges, we believe, is the most comprehensive picture available of Canadians' preferences for leaders' debates.
4.7.1 Goals of leaders' debates
We begin our exploration of Canadians' preferences from first principles: by asking participants to rank their top three goals from a pre-established set of possible goals for a leaders' debate. Half of the sample was randomly assigned to a prompt that asked them to rank the top three that were "most important to you personally," while the other half was randomly assigned to a prompt that asked them to rank the top three that they thought were "most important to Canadian democracy." In this way, we gain a window into whether Canadians' personal goals for leaders' debates differ from how they think the public interest should be served by the debates.
The results are presented in Figure 29. We report the percentage of participants who ranked the given objective as their top goal. The results are disaggregated by whether the participant was prompted to think about what was important to them personally (left) and what was important to Canadian democracy (right).
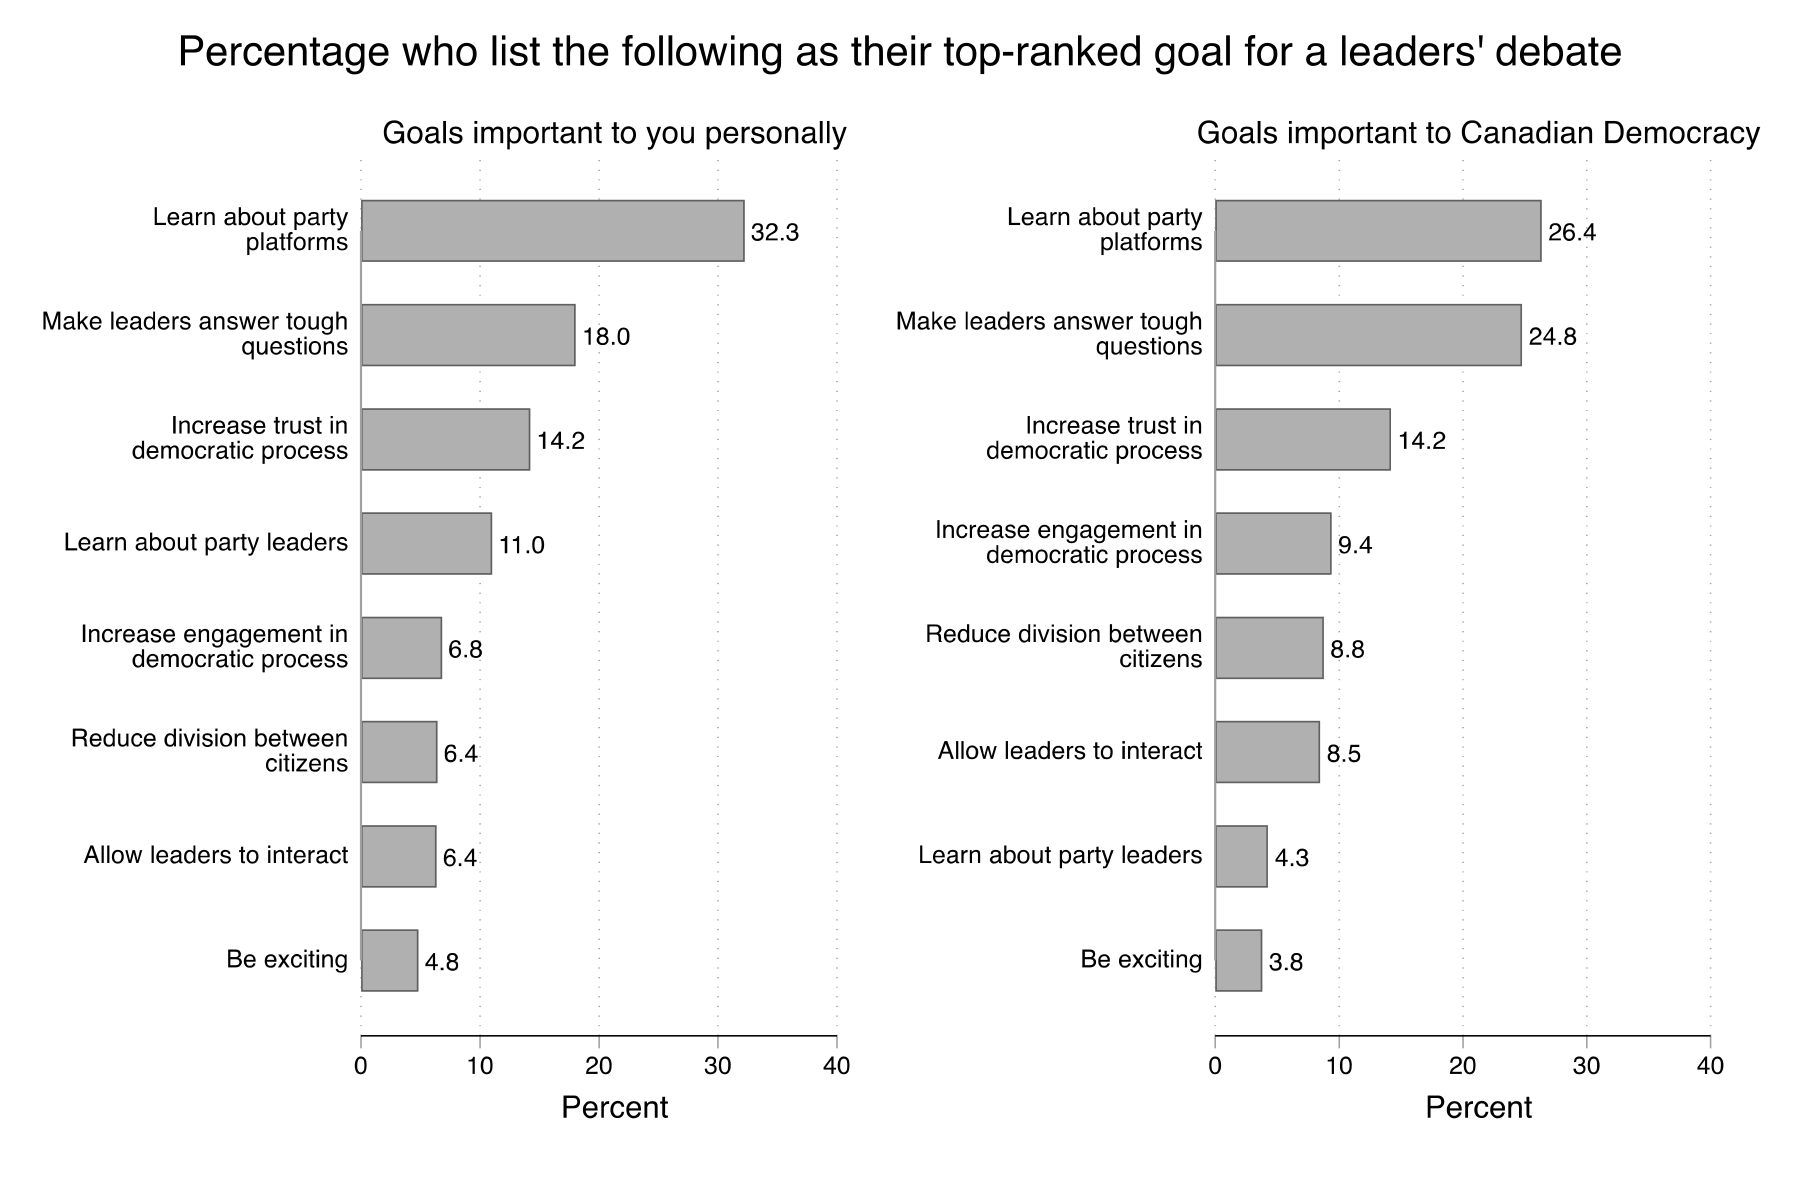
We highlight four findings. First, the most common top-ranked goal was to "Help citizens learn about the parties' platforms and promises." Roughly one-third (32%) of those in the "goals important to you personally" condition ranked this as their top goal, as did just over one-quarter (26%) of those in the "goals important to Canadian democracy" condition. Notably, however, not all learning goals were considered equal: far fewer participants in each condition identified helping "citizens learn about the party leaders" as their top ranked goal.
Second, the next most common top-ranked goal was to "Make party leaders answer tough questions." This was again the case regardless of question prompt. Debates as an exercise of accountability features prominently in Canadians' preferences. Third, a sizeable fraction of participants sought a debate that served to "Increase citizens' trust in the democratic process"—the third most common top-ranked debate goal (14% in each condition). We noted in Section 4.6.4 evidence that the 2021 debates did increase some forms of institutional trust—despite, or perhaps because, they at times incentivized conflict and opposition. We believe that further research can help inform debate designs that serve to make leaders answer difficult questions while still building trust in the democratic process.
Fourth, we highlight that 'debate as entertainment' holds little appeal for citizens. Less than 5% of participants reported that their top-ranked goal was for a debate to be "exciting." Similarly, relatively few citizens identified seeing the leaders interact as a key goal of a debate. This comparatively low priority for interaction as such mirrors the recurring distaste of focus group participants for debate segments that allowed the leaders to talk over each other. While debates provide a rare opportunity for leaders to interact, the results here imply that Canadians do not find this interaction an especially desirable end in itself. Nevertheless, leader interaction can still be put in service of other goals—such as promoting learning about party platforms and holding leaders accountable—provided that it is done in a manner that ensures that leaders speak only one at a time.
4.7.2 Leader participation
Next, we turn to examining citizens' preferences for leader participation within the context of a single debate. Canada has many political parties and deciding which party leaders to invite to a debate is necessarily a judgment call that is, understandably, a source of political contestation. We explored Canadians' preferences first using a series of four binary choice questions. For each question, participants are presented with two hypothetical debates and asked to choose which they prefer.
The results are reported in Figure 30. Two findings stand out. First, when presented with a hypothetical debate in which the leaders of the "six largest parties are invited to participate - and each leader has less time to speak" and a hypothetical debate in which the leaders of the "two largest parties are invited to participate - and each leader has more time to speak," 62% of participants chose the former. It is worth underscoring that this choice was made in full knowledge of the likely trade-off: namely, that more leaders would mean less time for each leader to speak.
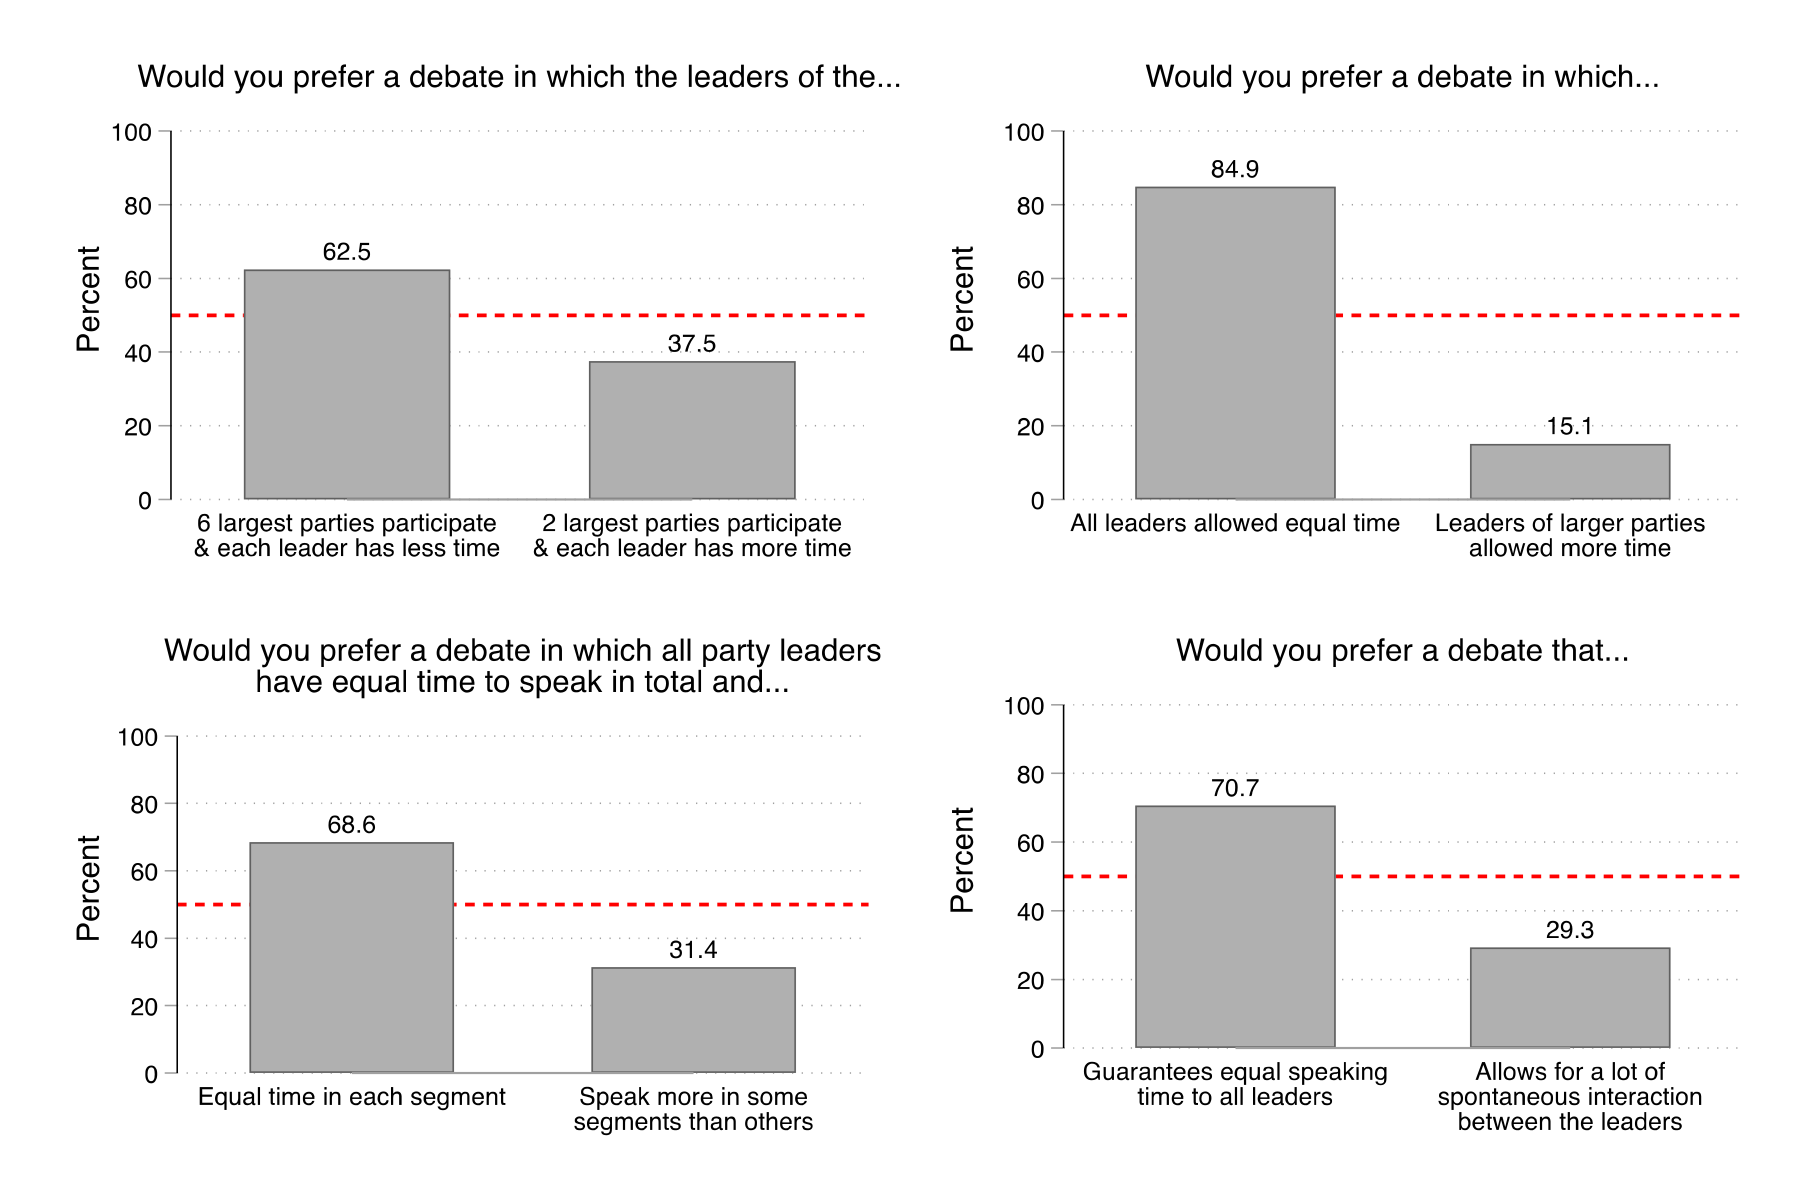
Second, participants strongly preferred—at least in the abstract—an equal allocation of speaking time between those leaders who are invited to participate in a debate. A very large majority (85%) preferred a debate in which all leaders were allocated equal time to a debate in which the leaders of the larger parties received more speaking time than the leaders of the smaller parties. This preference for equal treatment holds not simply for the debate as a whole: a large majority (67%) preferred a debate in which all leaders have equal time in each segment to a debate in which the leaders speak more in some segments than others—even though, by construction, both options were presented as providing equal time in total to the leaders. Furthermore, another large majority of Canadians appears willing to trade spontaneity for equal time: 71% favoured a debate that "guarantees equal speaking time to all leaders - even though this means only a little time for spontaneous interaction between the leaders" to a debate that "allows for a lot of spontaneous interaction between the leaders - even though this means they may not have equal speaking time."
We further probed Canadians' preferences for how time should be allocated between party leaders by making the available choices more concrete. Elsewhere in the survey, participants were asked to imagine that they were responsible for organizing one, two-hour debate during the next federal election and that their job was "to decide how best to divide up this time." They were asked to assign a percentage of time to each leader. Participants could assign a value from 0% to 100% for each leader—provided that the total allocations summed to 100%.
Figure 31 reports the mean percentage of debate time that participants allocated to each leader. The results suggest that, when this task is made more concrete, we do see some evidence of departures from perfect equality. The mean allocation for the two largest parties—the Liberals and the Conservatives—was in the order of 21% of the available time, while the mean allocation for the three smallest parties—the BQ, the Greens and the PPC—was in the order of 13% of the available time. The NDP fell between these two sets with a mean allocation of 17% of the available time.
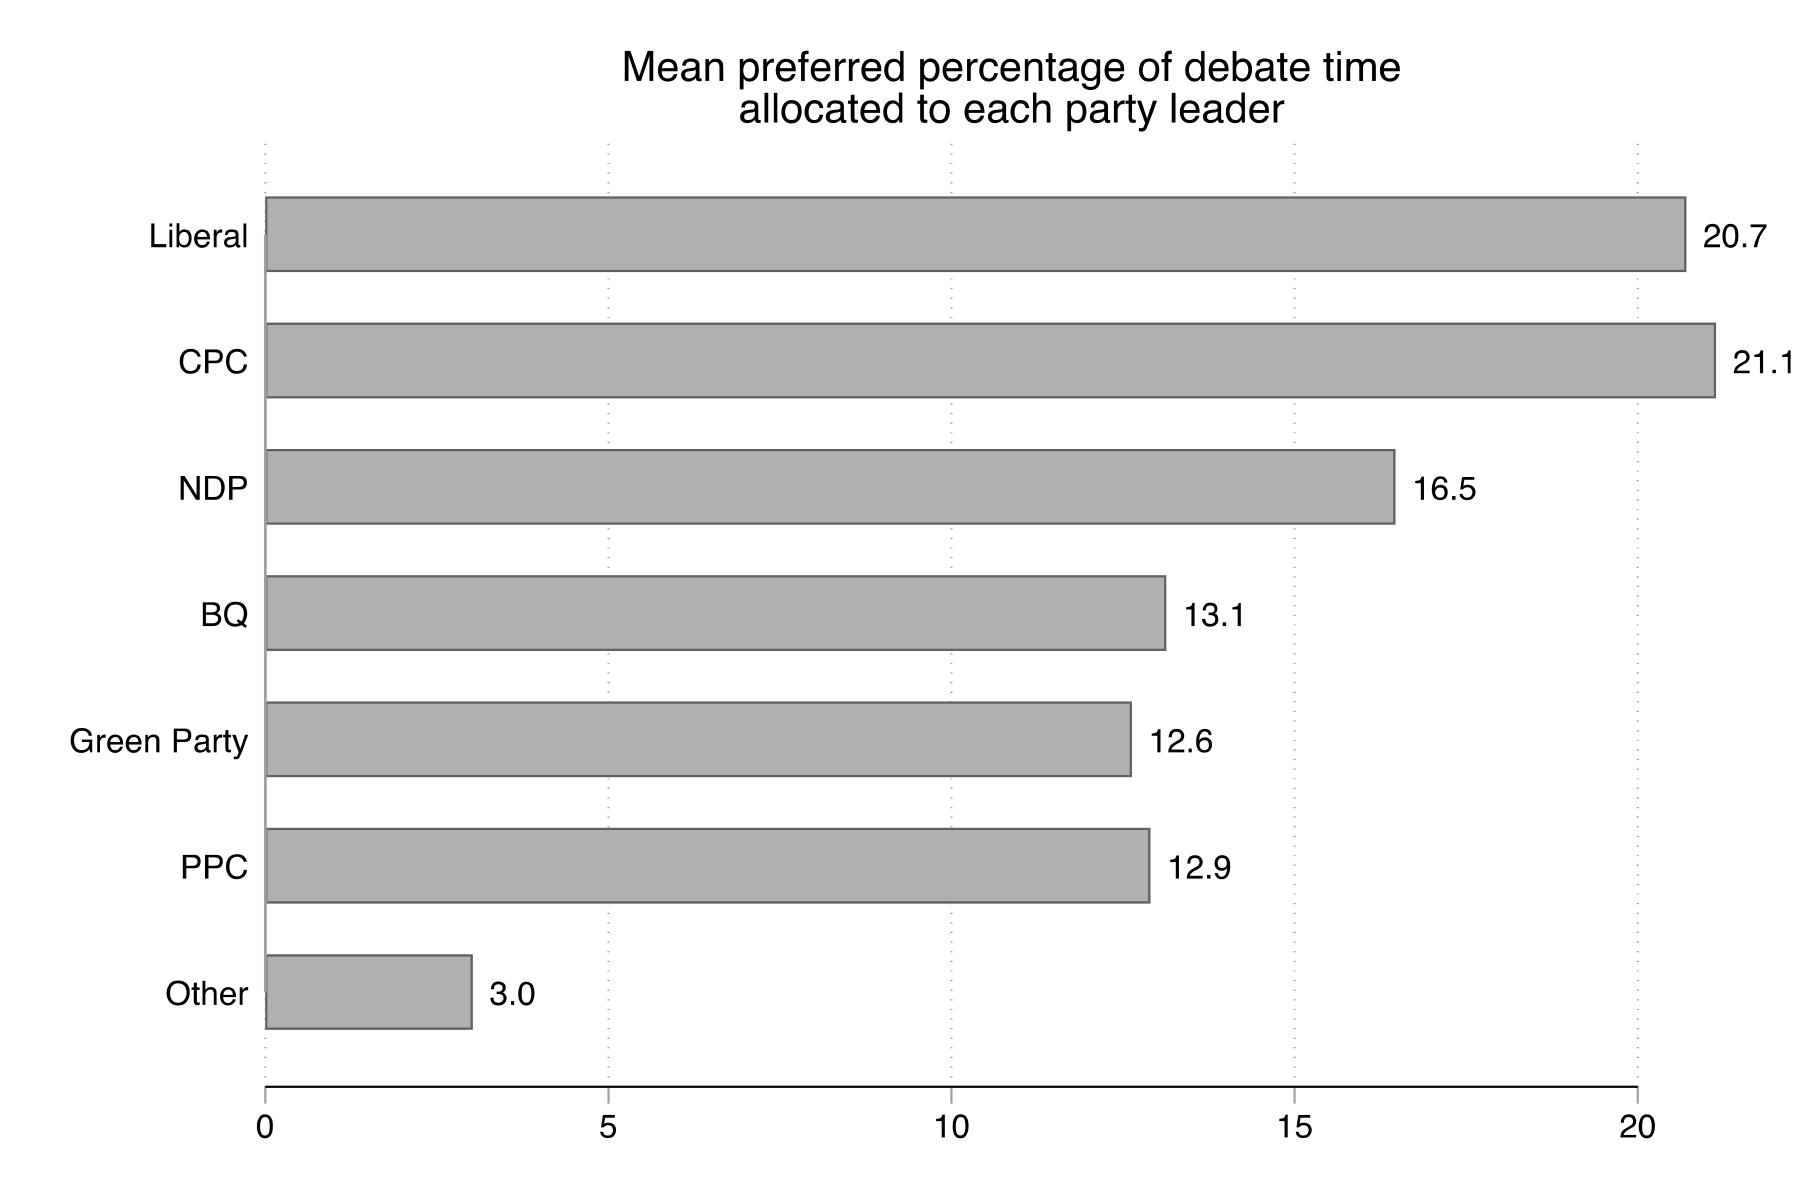
While there are noticeable differences in allocation between some of these parties, it is worth recognizing that the substantive departure from equality remains relatively modest. Consider that perfect equality between six parties (setting aside the unspecified "Other" in the question) would imply a 100/6 = 17% allocation for each party. Thus, the mean allocation for the two largest parties is only 4 percentage points higher than perfect equality and the mean allocation for the three smallest parties is only 4 percentage points lower than perfect equality.
4.7.3 Moderation and the sources of questions
A key design consideration of many modern leaders' debates is the nature of the moderation and, more broadly, of the sources of the questions put to the party leaders. We approach this again from multiple perspectives: by asking participants to choose between hypothetical pairs of debates that differ with respect to the moderation; by asking participants what they believe a moderator's role should be; and by asking participants to allocate a share of questions according to their preferred sources (e.g., the moderator, the public, journalists, etc.).
Figure 32 presents five sets of binary choices. We highlight three findings. First, Canadians strongly prefer a debate in which the moderator provides an accountability role to one in which the moderator takes on a more limited role. Nearly nine in ten (88%) preferred a debate in which the moderator asked the leaders "tough questions - even though this means you may disapprove of some of the moderator's questions" to a debate where the moderator asked "easy questions - even though this means you may find some of the moderator's questions dull." It is worth underscoring that this preference for "tough questions" came with the understanding that they, as viewers, might disapprove of some of the questions. A similarly large majority (86%) favoured a debate in which the moderator served as a fact checker—even though this role came at the price of less speaking time for the leaders.
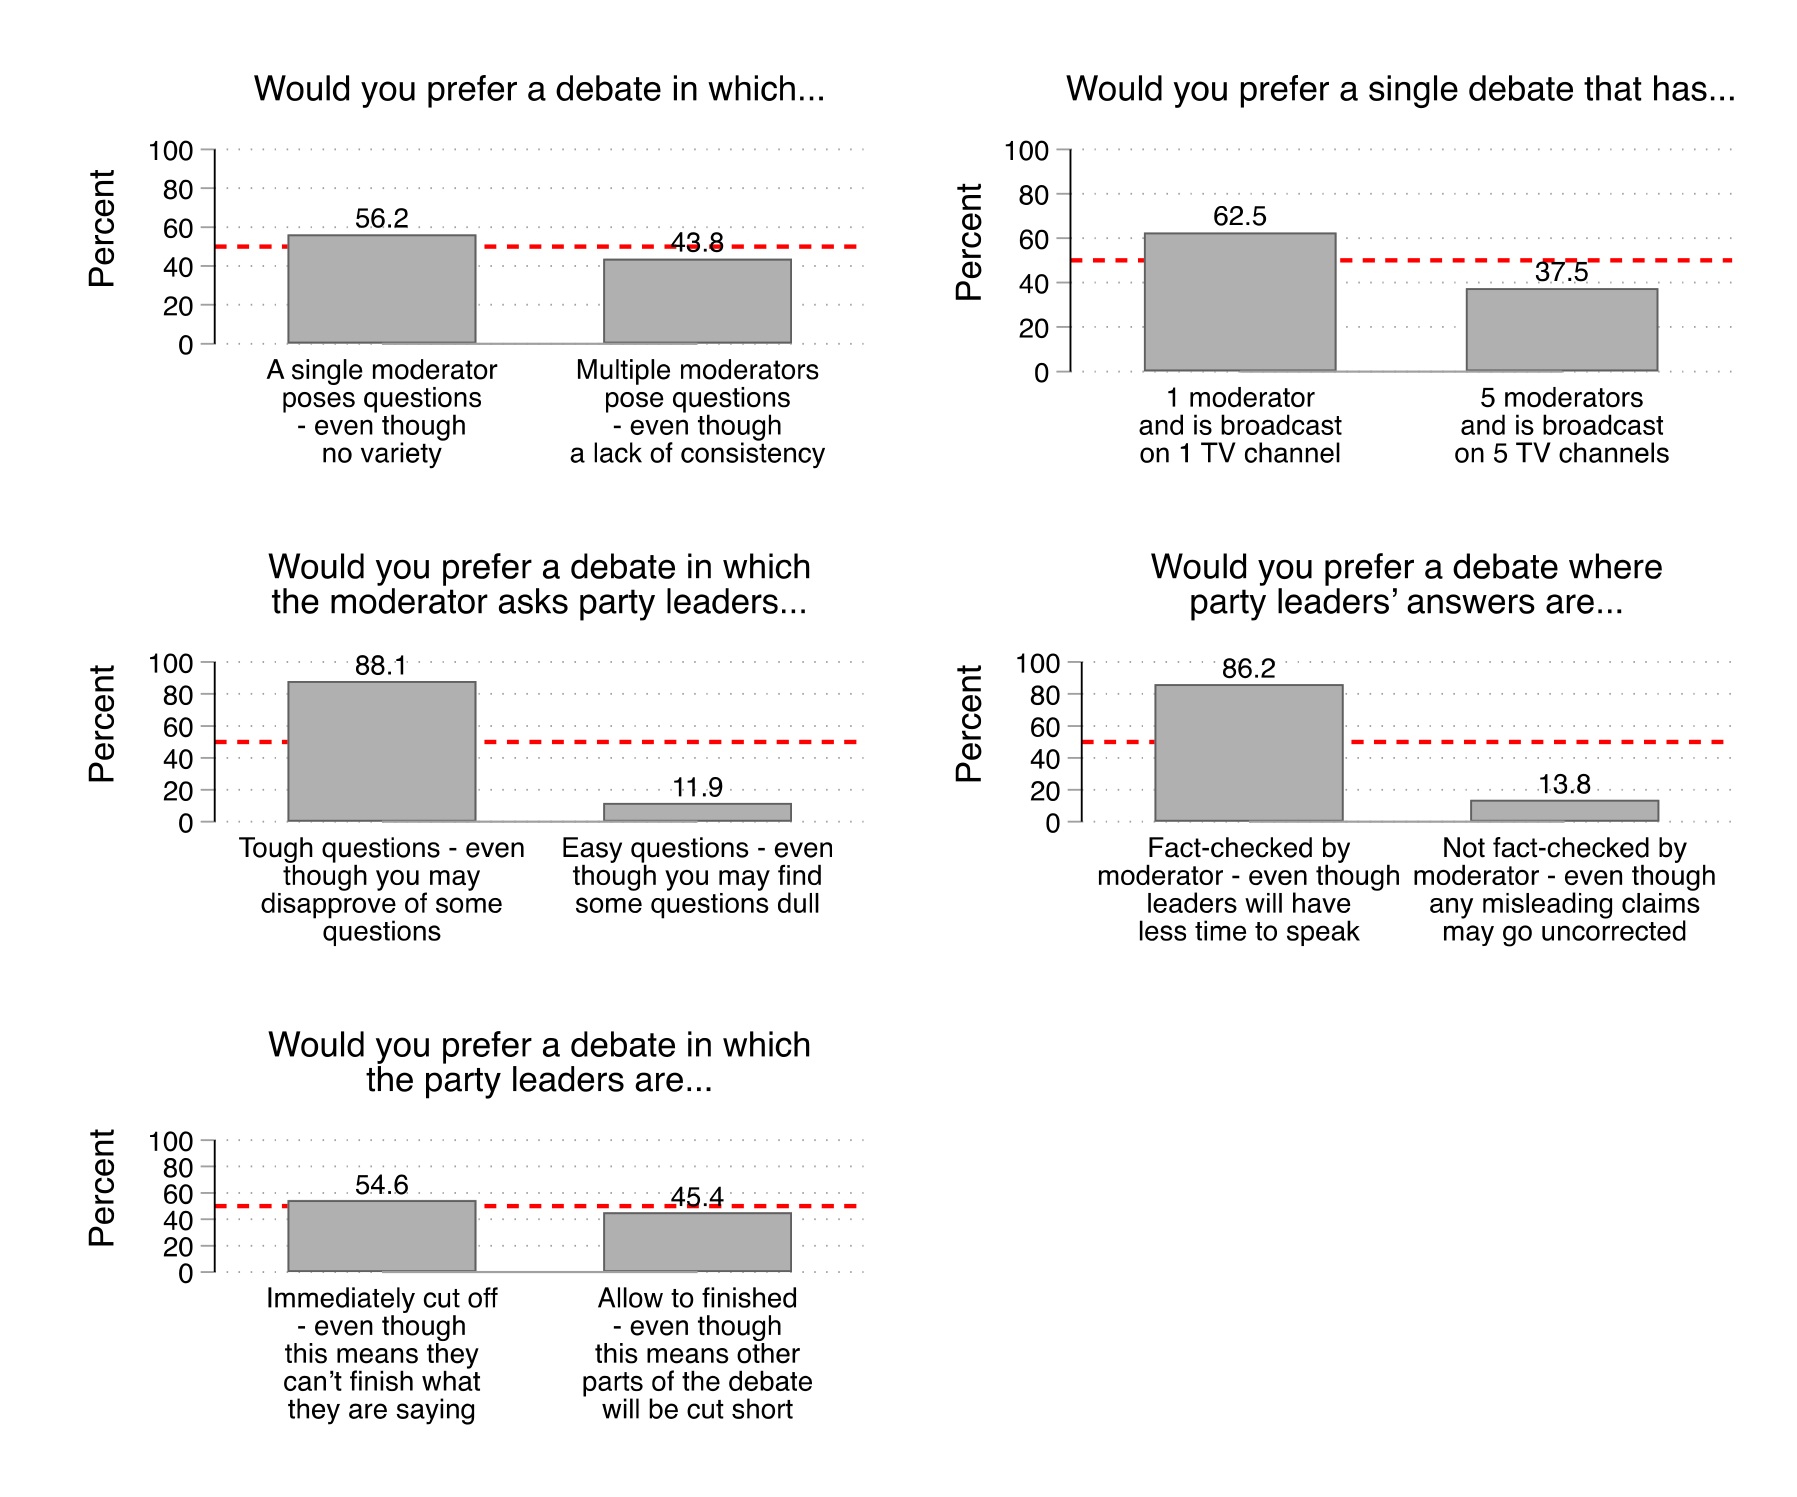
Second, more modest majorities favored a debate with a single moderator to a debate with multiple moderators—regardless of whether this choice was framed as a trade-off in terms of variety or a tradeoff in terms of channel access. For example, 63% favoured a debate with a single moderator that was broadcast on a single channel to a debate with five moderators that was broadcast on five channels.
Third, Canadians were relatively evenly split about how to manage leaders who might exceed their allotted time. Just over half (55%) preferred a debate in which the party leaders are "immediately cut off when they reach their time limit - even though this means they can't finish what they are saying" to one in which the leaders are "allowed to finish what they are saying - even though this means that other parts of the debate will be cut short to make up for lost time." This split, we believe, reflects the views of many focus group participants who thought that cutting leaders off was impolite—while still recognizing that some kind of cut off was a 'necessary evil.' Future debate organizers may wish to reflect on how they can simultaneously pursue a debate in which time is closely regulated (per the public's preference for equal time between leaders) while still minimizing the need for—or the obtrusiveness of—cutting off leaders who run long.
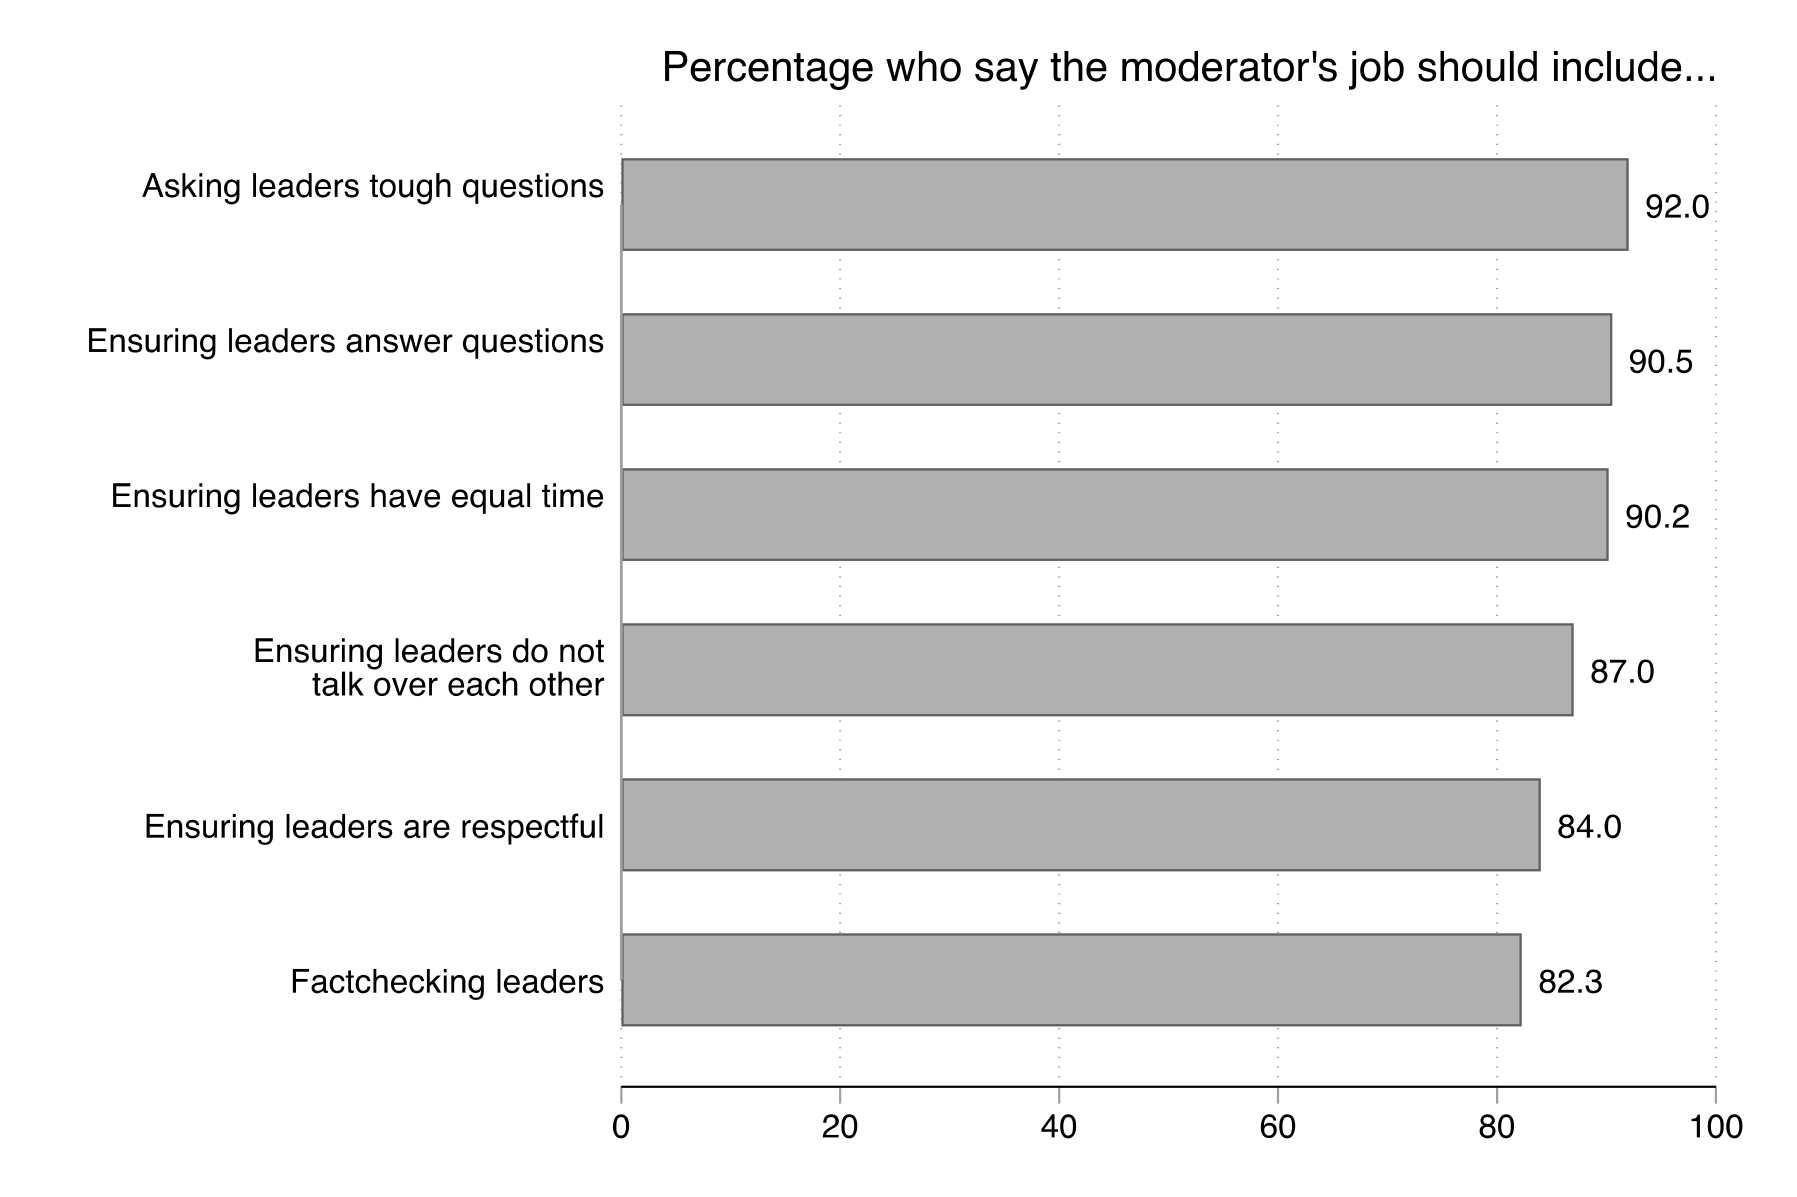
Next, we turn to what Canadians think are the appropriate roles for a debate moderator. In this question, participants were presented with a list of six possible roles and asked which they thought should be part of a moderator's job. The results, presented in Figure 33, are striking. In each instance, no fewer than four in five felt that each role was indeed part of the moderator's job. The public's aggregate preference is thus far from 'laissez-faire' moderation. Very large majorities want the moderator to ask tough questions of the leaders; to ensure that the leaders answer these questions; to enforce equal time among leaders; to make sure the leaders do not talk over each other; to ensure the leaders are respectful of each other; and to fact-check leaders' answers. In short, most Canadians want the moderator to be a key actor in the debate through promoting accountability and ensuring fair play.
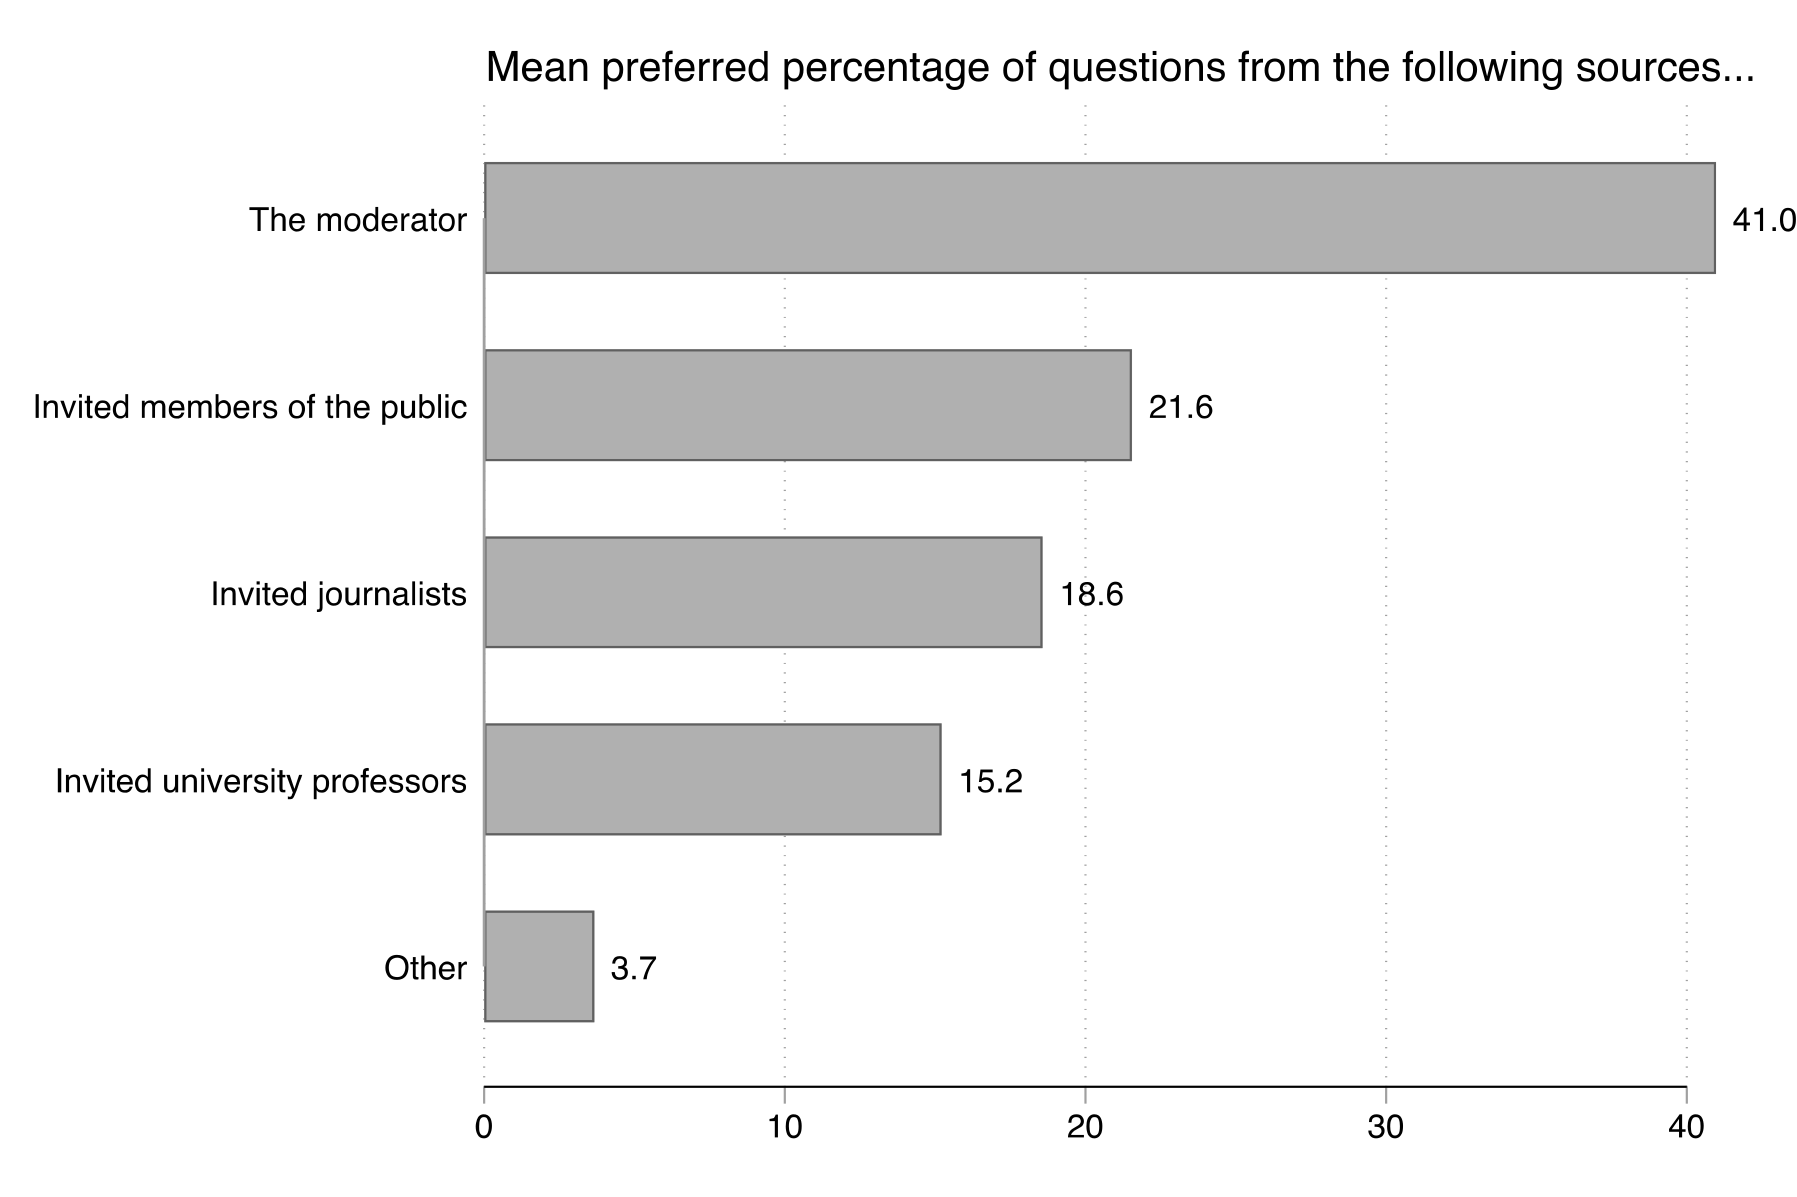
The moderator is not the only possible source of questions put to the leaders in a debate. Indeed, the 2021 debates included questions from other sources: journalists were invited to ask questions live, as were a handful of members of the public. How do Canadians feel about these sources? To answer this, we again asked participants to undertake a constrained allocation task: that is, to assign a percentage of questions to various possible sources. Participants could allocate anywhere from 0 to 100% of questions to a given source—provided that the total allocations summed to 100%.
Figure 34 reports the mean percentage allocated to each source. Canadians, on average, wanted the moderator to ask the most questions: roughly 2 of every 5 questions. Next, participants, wanted to see members of the public asking 22% of questions on average—slightly ahead of journalists at 19%. For comparison, we included "university professors" as a possible question source—though this is not a common practice in federal leaders' debates in Canada. Of the available sources, professors were the least popular—allocated only 15% of questions on average. These results largely echo the preceding findings: Canadians see a vital role for the moderator in a debate, but also seek to reserve some space for the public and for other journalists to put their questions.
4.7.4 Debate topics
The choice of topics is another crucial ingredient in any debate—not least because, as noted in Section 4.5.1, many viewers of the 2021 debates found that these events did not cover the issues that were most important to them. Indeed, satisfying the diverse interests of the Canadian public in a two-hour period is a significant challenge. The choice of topics requires balancing at least two important considerations: the number of topics and the depth of discussion of each. While including more topics in a given debate help it cover the issues of interest to more Canadians, this may come at the price of depth—reducing the time available to cover the party platforms in the detail that Canadians want.
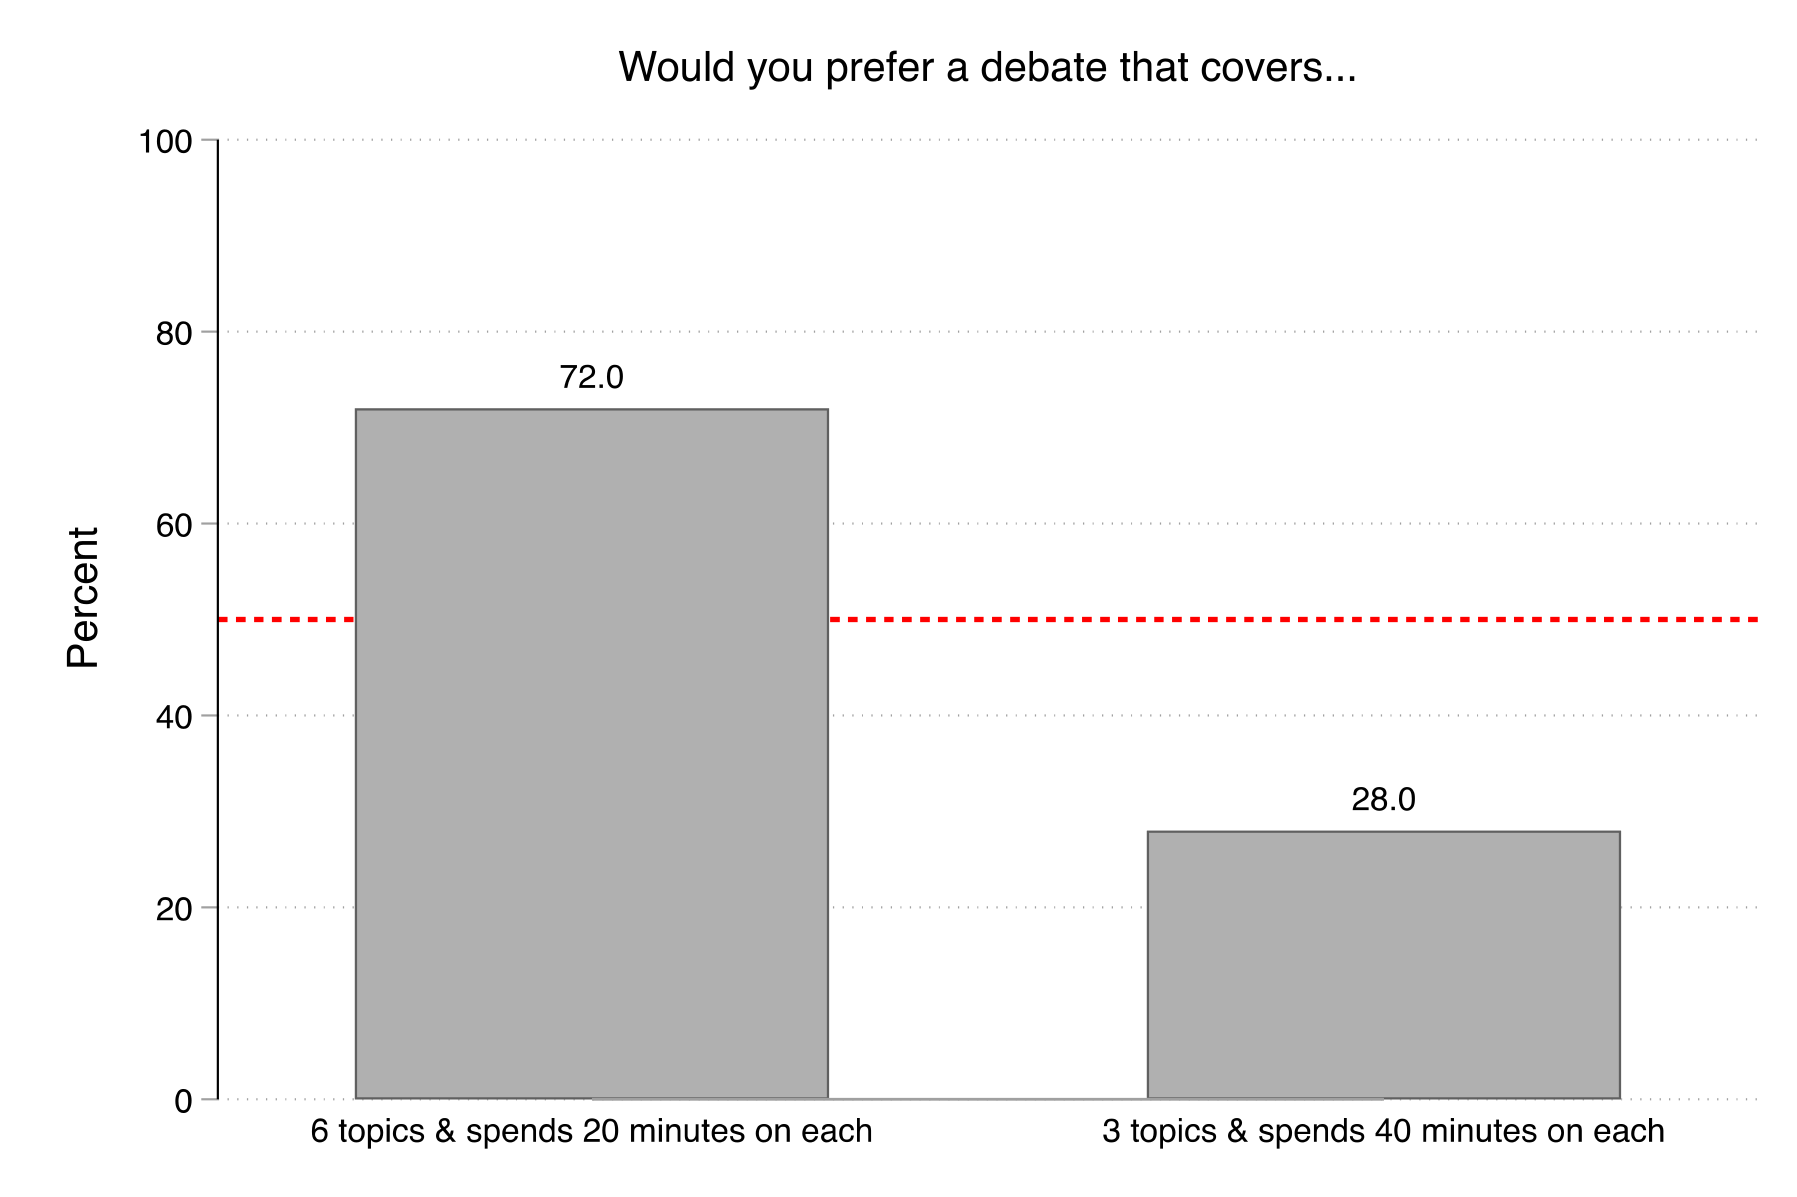
We put this tradeoff to survey participants—asking which they would prefer: a debate that covers "3 topics and spends 40 minutes on each topic" or a debate that covers "6 topics and spends 20 minutes on each topic." The results are reported in Figure 35. Nearly three-quarters preferred the six-topic debate. (In Section 4.7.8, we explore the appeal of single-topic debates in the context of possible campaigns with more than one debate in each official language.)
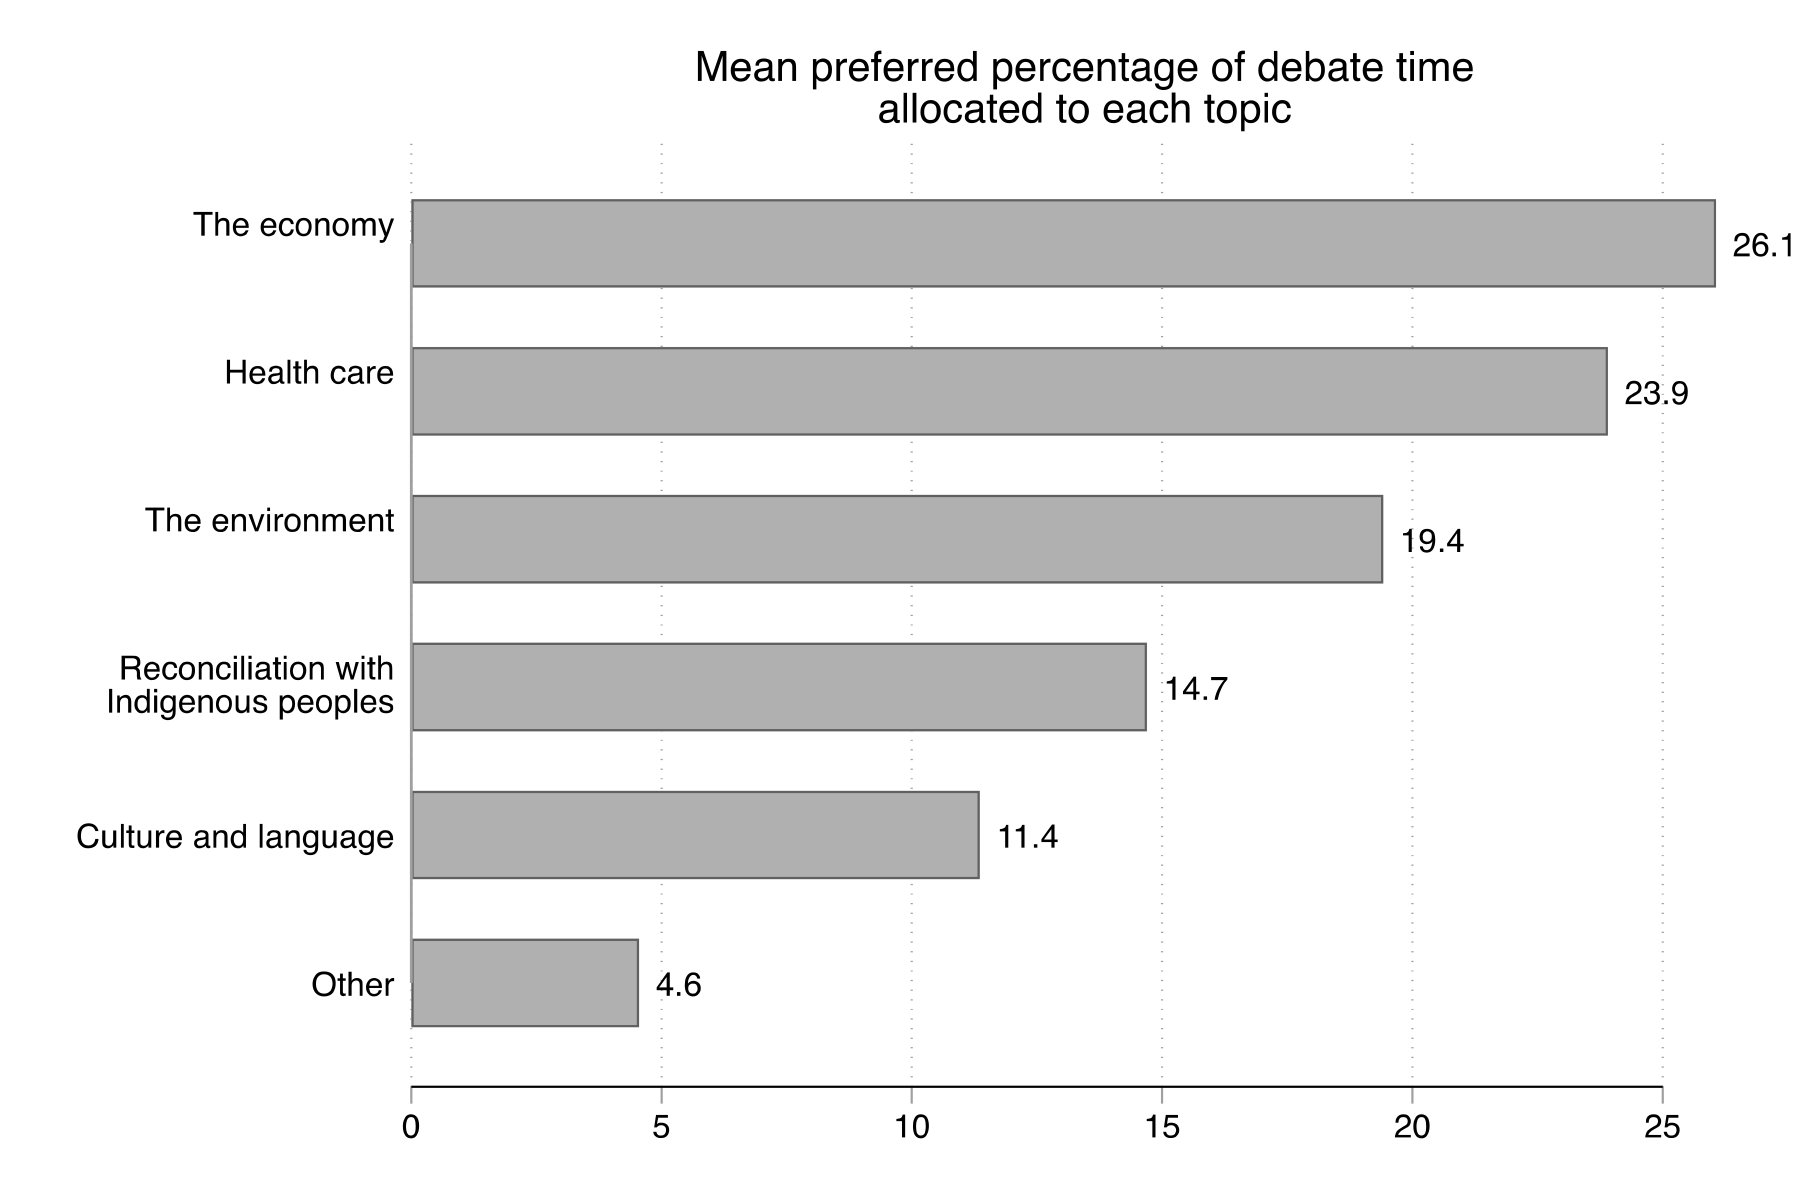
We also probed the preferences for debate topics further with another time allocation task—again asking participants to divide up the available time of a single debate between a set of five pre-selected topics. Figure 36 reports the mean percentage of debate time allocated by participants to each topic. The results confirm the appeal of a debate with several topics, while also suggesting an openness to allocating more time to some topics than others.
4.7.5 Debate formats
Format has an important bearing on the conduct of any debate and potentially influences how debates can achieve Canadians' top ranked goals of learning about the parties, holding leaders accountable, and building trust in the democratic process. We begin our exploration with four binary questions pertaining to debate format. For each question, participants were again asked to choose which of the two hypothetical debates they preferred. The results are reported in Figure 37.
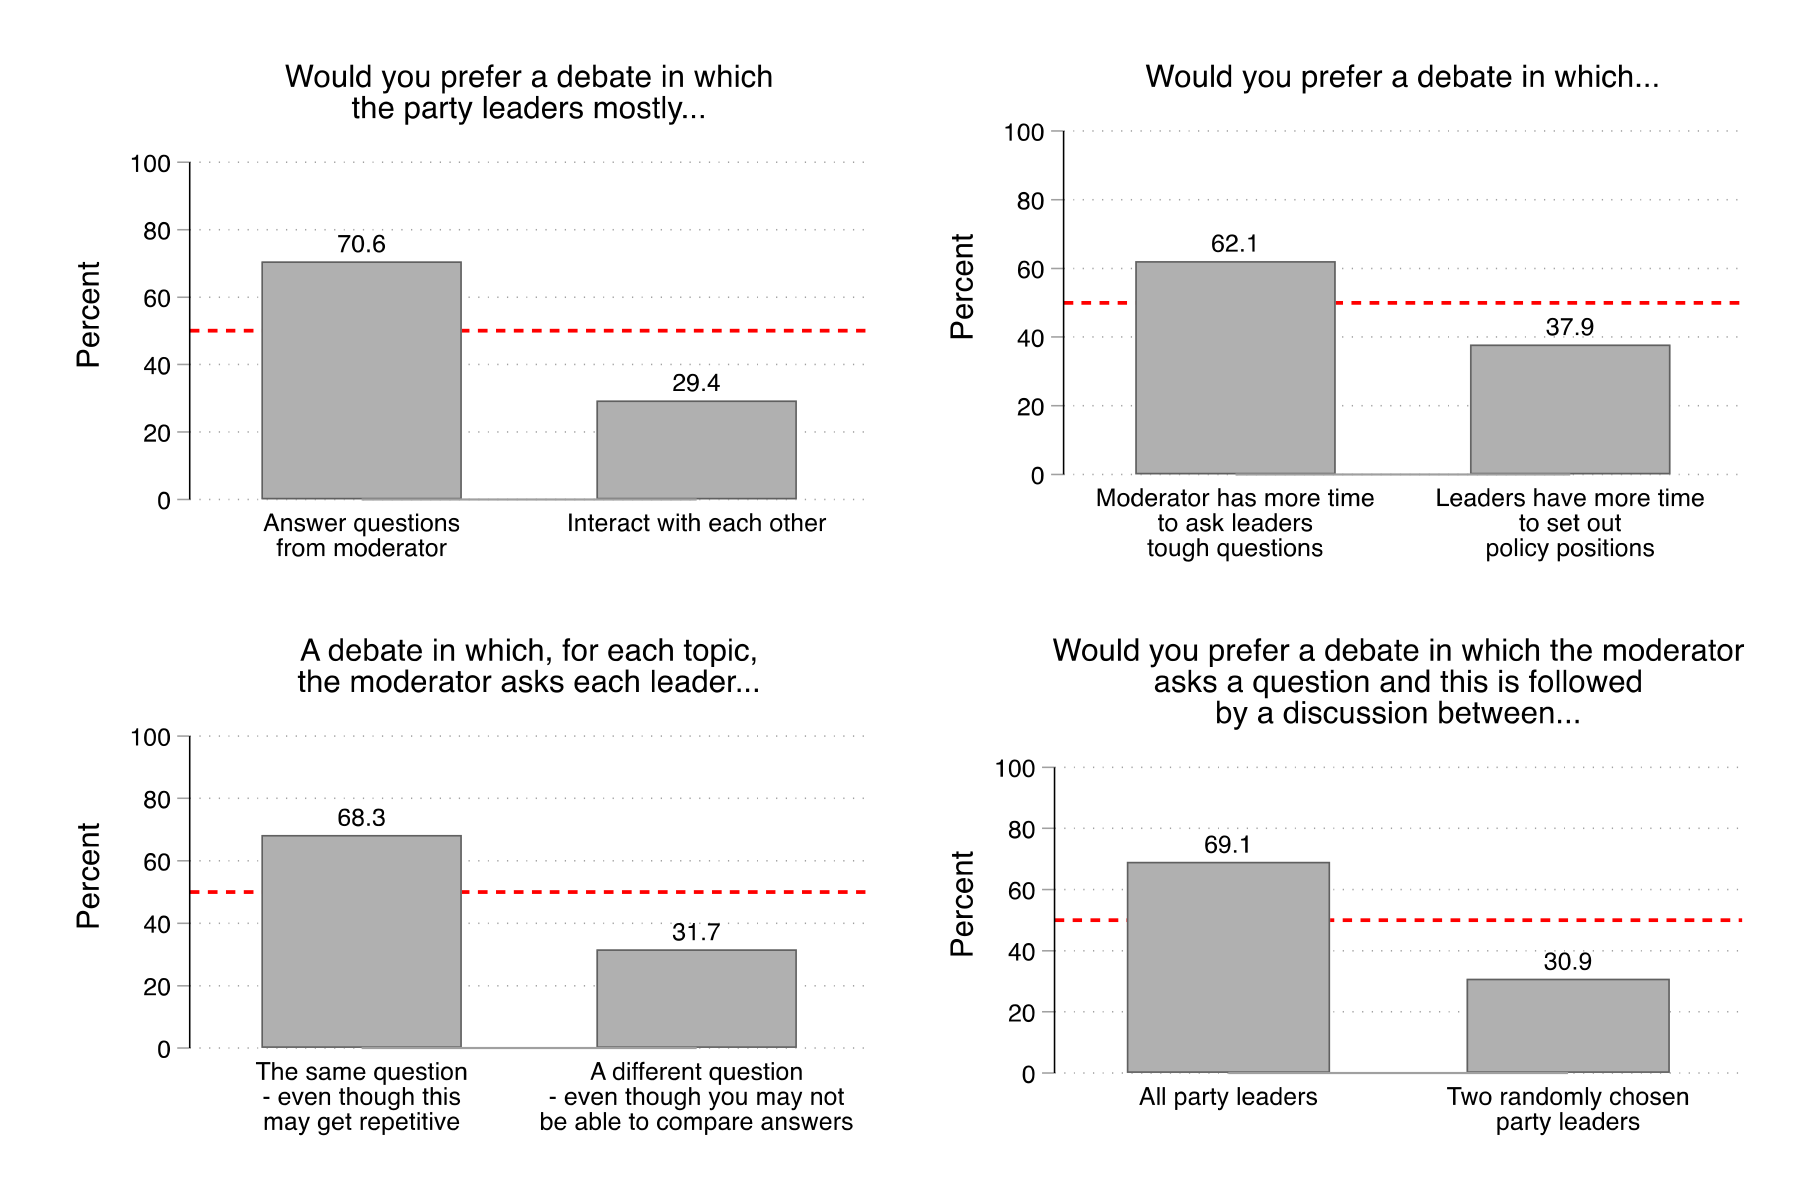
We make four findings. First, over seven in ten (71%) favoured a debate in which the leaders mostly answered questions from the moderator over a debate where the leaders mostly interacted with each other. Second, a majority (62%) again favoured the moderator-centered questioning model over a model in which leaders have more time "to set out their policy positions in detail." Third, with respect to the moderators' questions, just over two-thirds (68%) favoured asking each leader the same question "even though this may get repetitive" over a debate in which the moderator asks each leader a different question. Fourth, following on this same theme, we find that 69% of Canadians favoured a debate in which the moderator poses a question and the ensuring discussion includes all party leaders—compared to a debate in which the ensuing discussion involves only two leaders chosen at random. While the random selection of leaders is a common strategy for managing some parts of a debate, Canadians again appear to prefer greater inclusion—a preference that reflects their commitment to the equal participation of leaders noted earlier. The challenge remains how to build an inclusive debate featuring several party leaders, while still avoiding situations where the leaders talk over each other.
To explore these format preferences from a different perspective, we again asked participants to engage in a time allocation task for a single, two-hour debate in the next federal election. Participants were asked to allot time across three possible formats: (1) "The party leaders answer questions asked by the moderator"; (2) "The party leaders interact with each other without the involvement of the moderator"; (3) "The party leaders set out their policy positions in detail and without interruption." Participants' responses were constrained such that the total of the allotted percentages summed to 100. The results are reported in Figure 38.
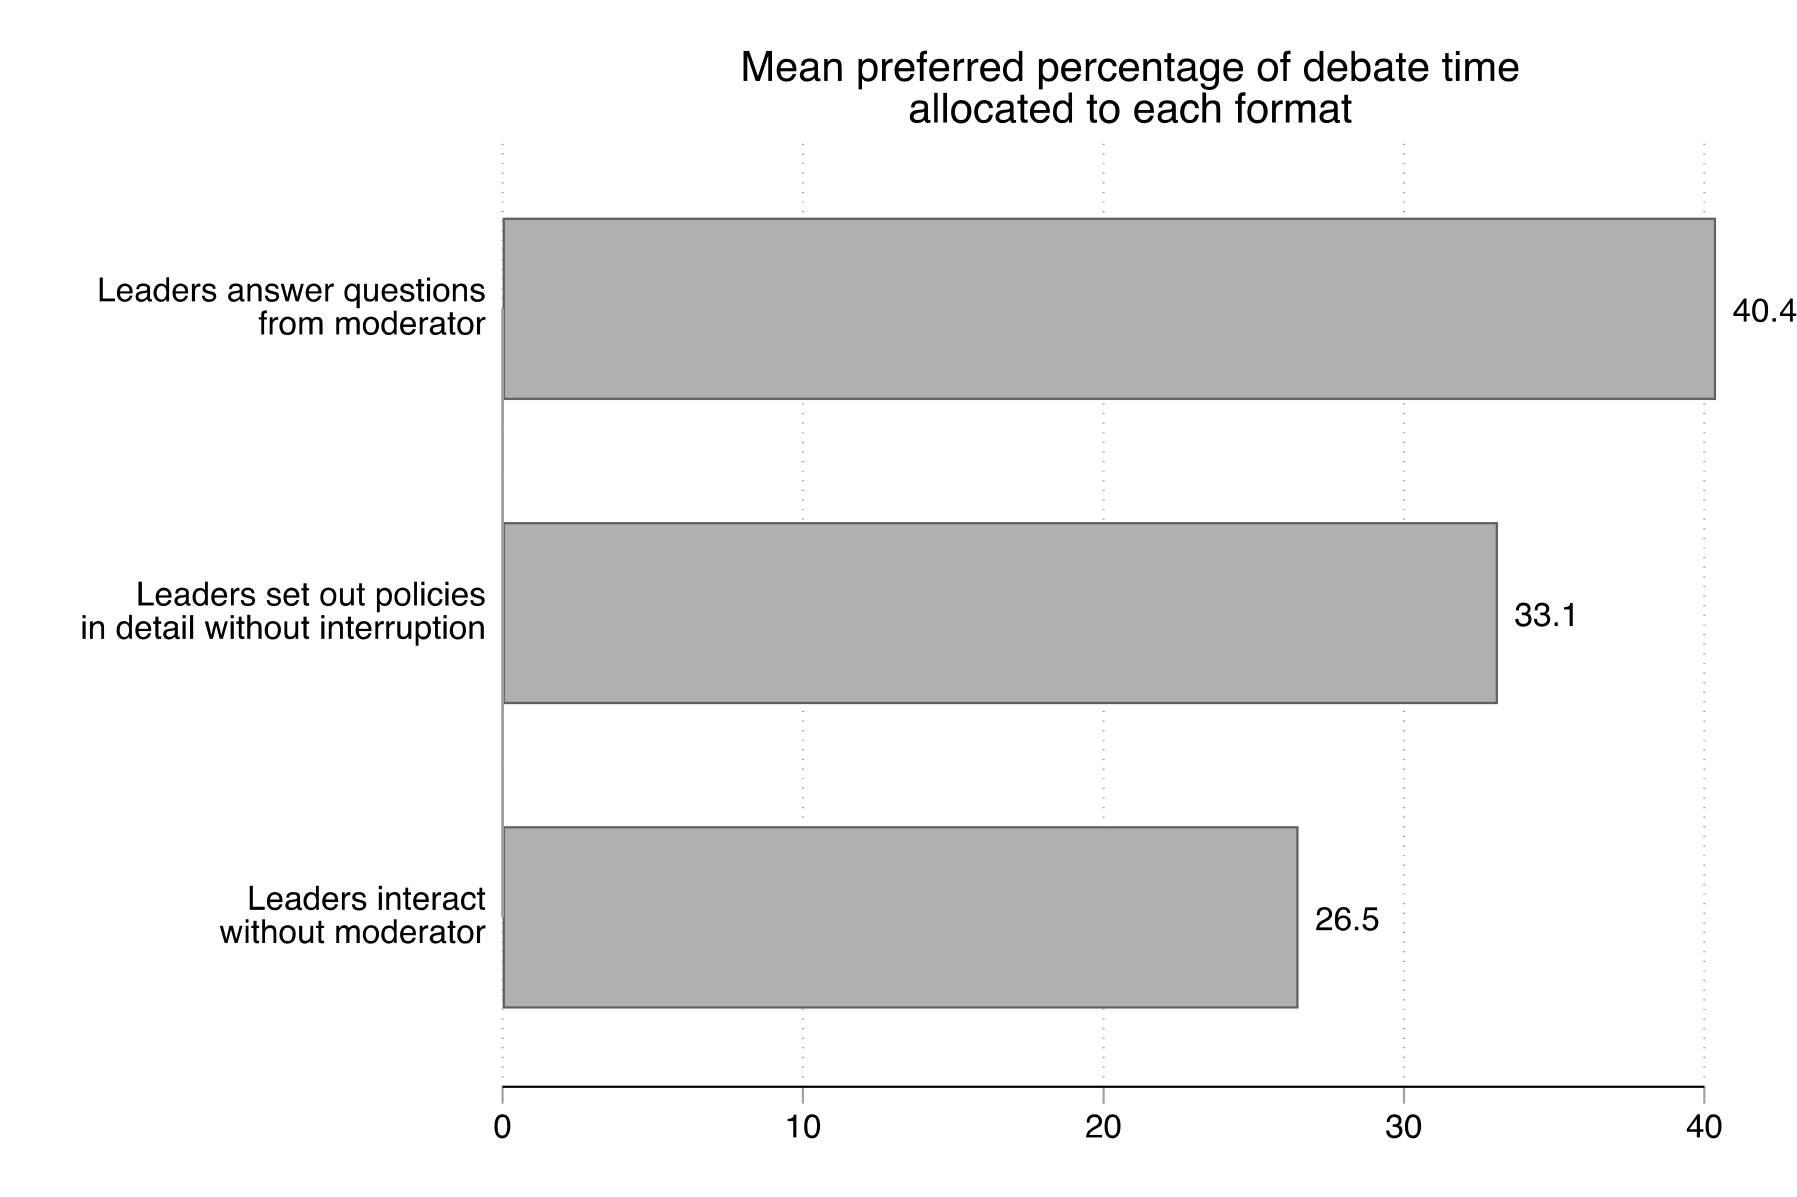
Echoing previous results, a moderator-centric format received the greatest time allocation. Participants on average assigned 40% of the debate time to having leaders answer questions from the moderator. Having said this, participants on average still reserved a third of the time for the leaders to set out their policies without interruption. This format also reflects comments from some focus group participants who wanted debates as a means of efficiently getting up to speed on what the parties were promising during the campaign. Lastly, just over a quarter of the time (27%) was allocated on average to leaders interacting without the moderator. While we find that this kind of interaction was not a leading goal for the debates as such, Canadians may understandably see between-leader interaction as facilitating the kind of learning and accountability they are looking for.
4.7.6 Scheduling the debates
Given that being "too busy" was a common reason for not watching a 2021 debate, we asked participants in the third survey their preference for when to watch a debate live. This was elicited in two steps: first, participants were asked whether they would be more likely to watch on a weekday or a weekend; second, participants were asked their preferred time of day (choosing from 3, 6, 7, 8, or 9 pm ). Participants were informed that all times were local to their area. We combined the answers to the two questions and report the results in Figure 39.
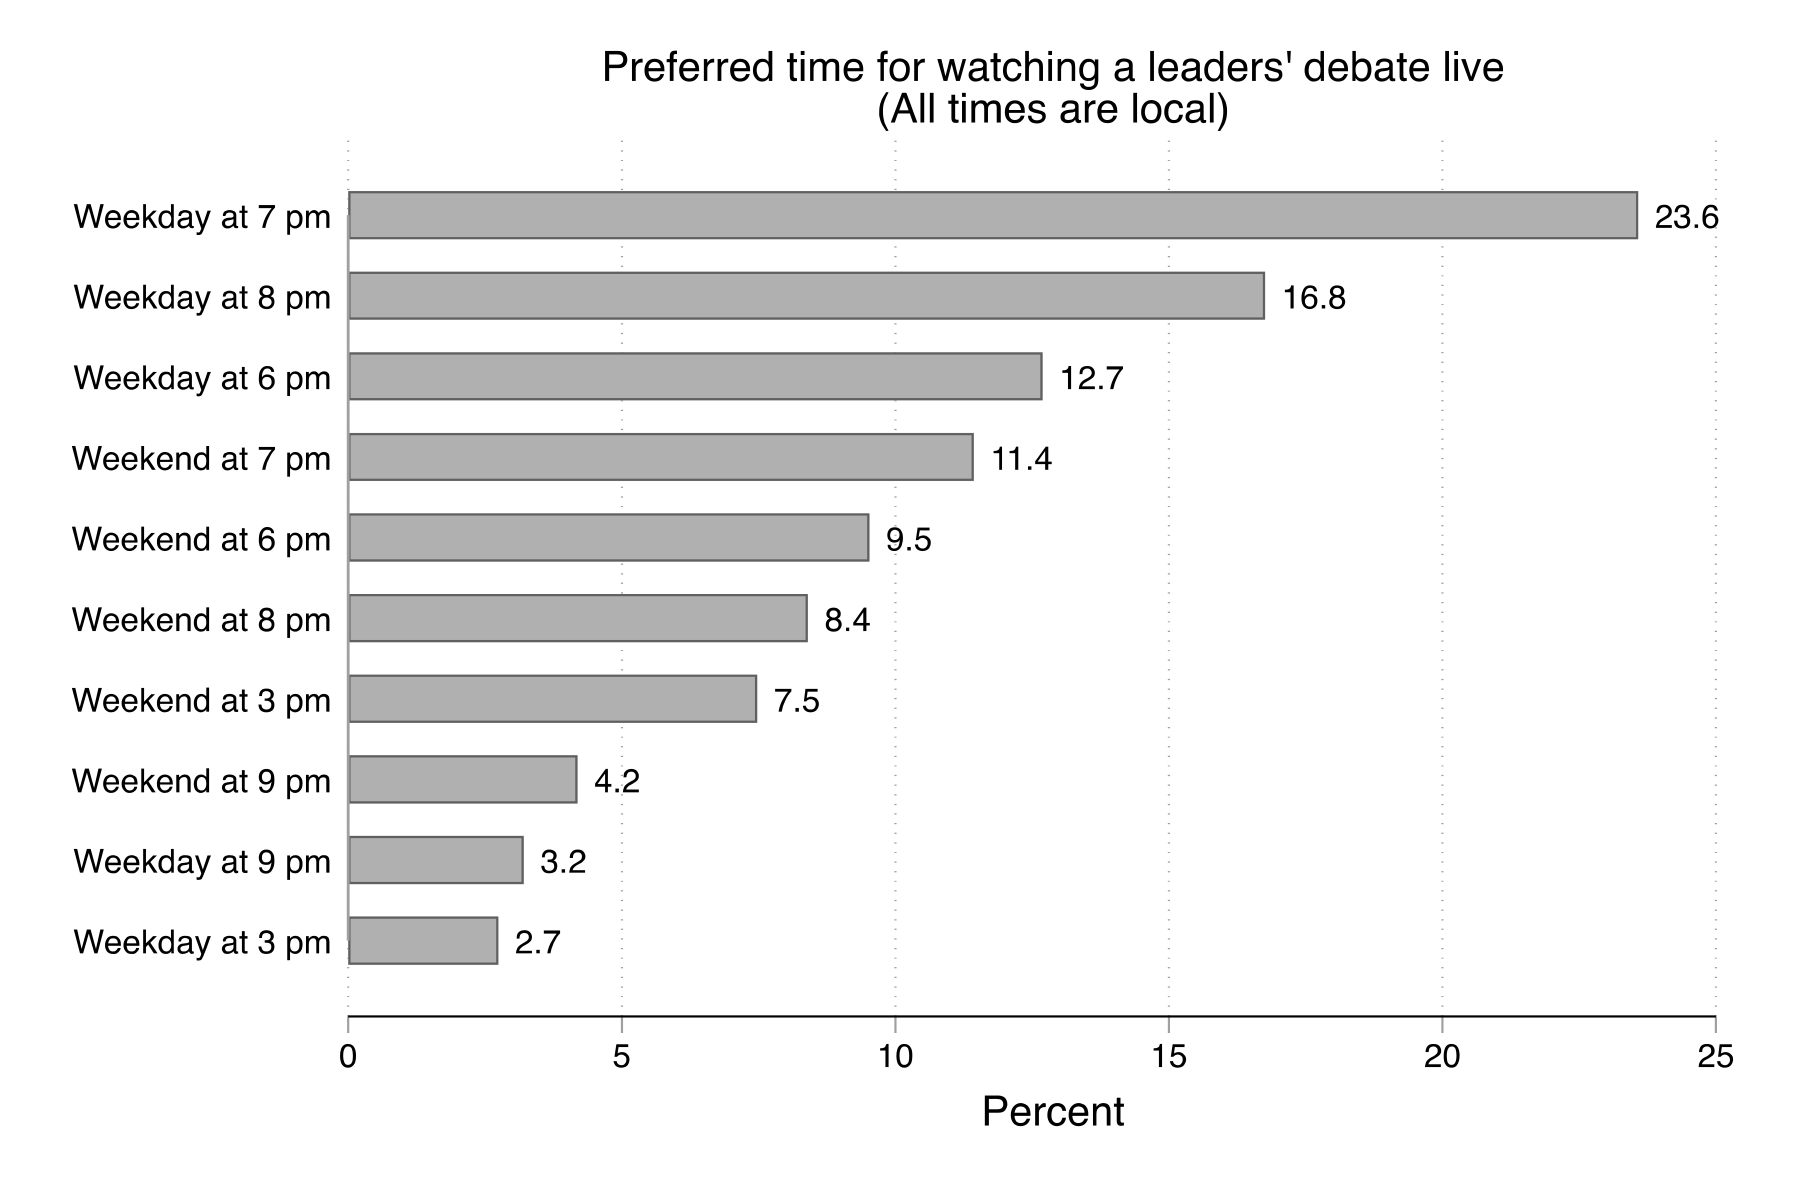
The most popular time to watch a debate live—chosen by 24% of participants—is on a weekday at 7 pm. The next two most popular times were on either side of this time slot: namely, 8 pm and 6 pm weekdays. Notably, the least popular times were those early in the day (3 pm) and late in the day (9 pm)—and this was the case whether the debate fell on a weekday or a weekend.
To be sure, accommodating these scheduling preferences cannot be readily done in the context of a single live debate given Canada's time zones. For example, a weekday debate that starts at 7 pm in the Atlantic time zone (the most preferred time) means a 3 pm start in the Pacific time zone (the least preferred time). Solutions may require further creative thinking that could involve the implementation of regionally-based leaders' debates, the re-broadcast of previously recorded debates in their entirety, or the increased promotion of on-demand clips of the debates through news sites and social media.
4.7.7 Stage arrangements
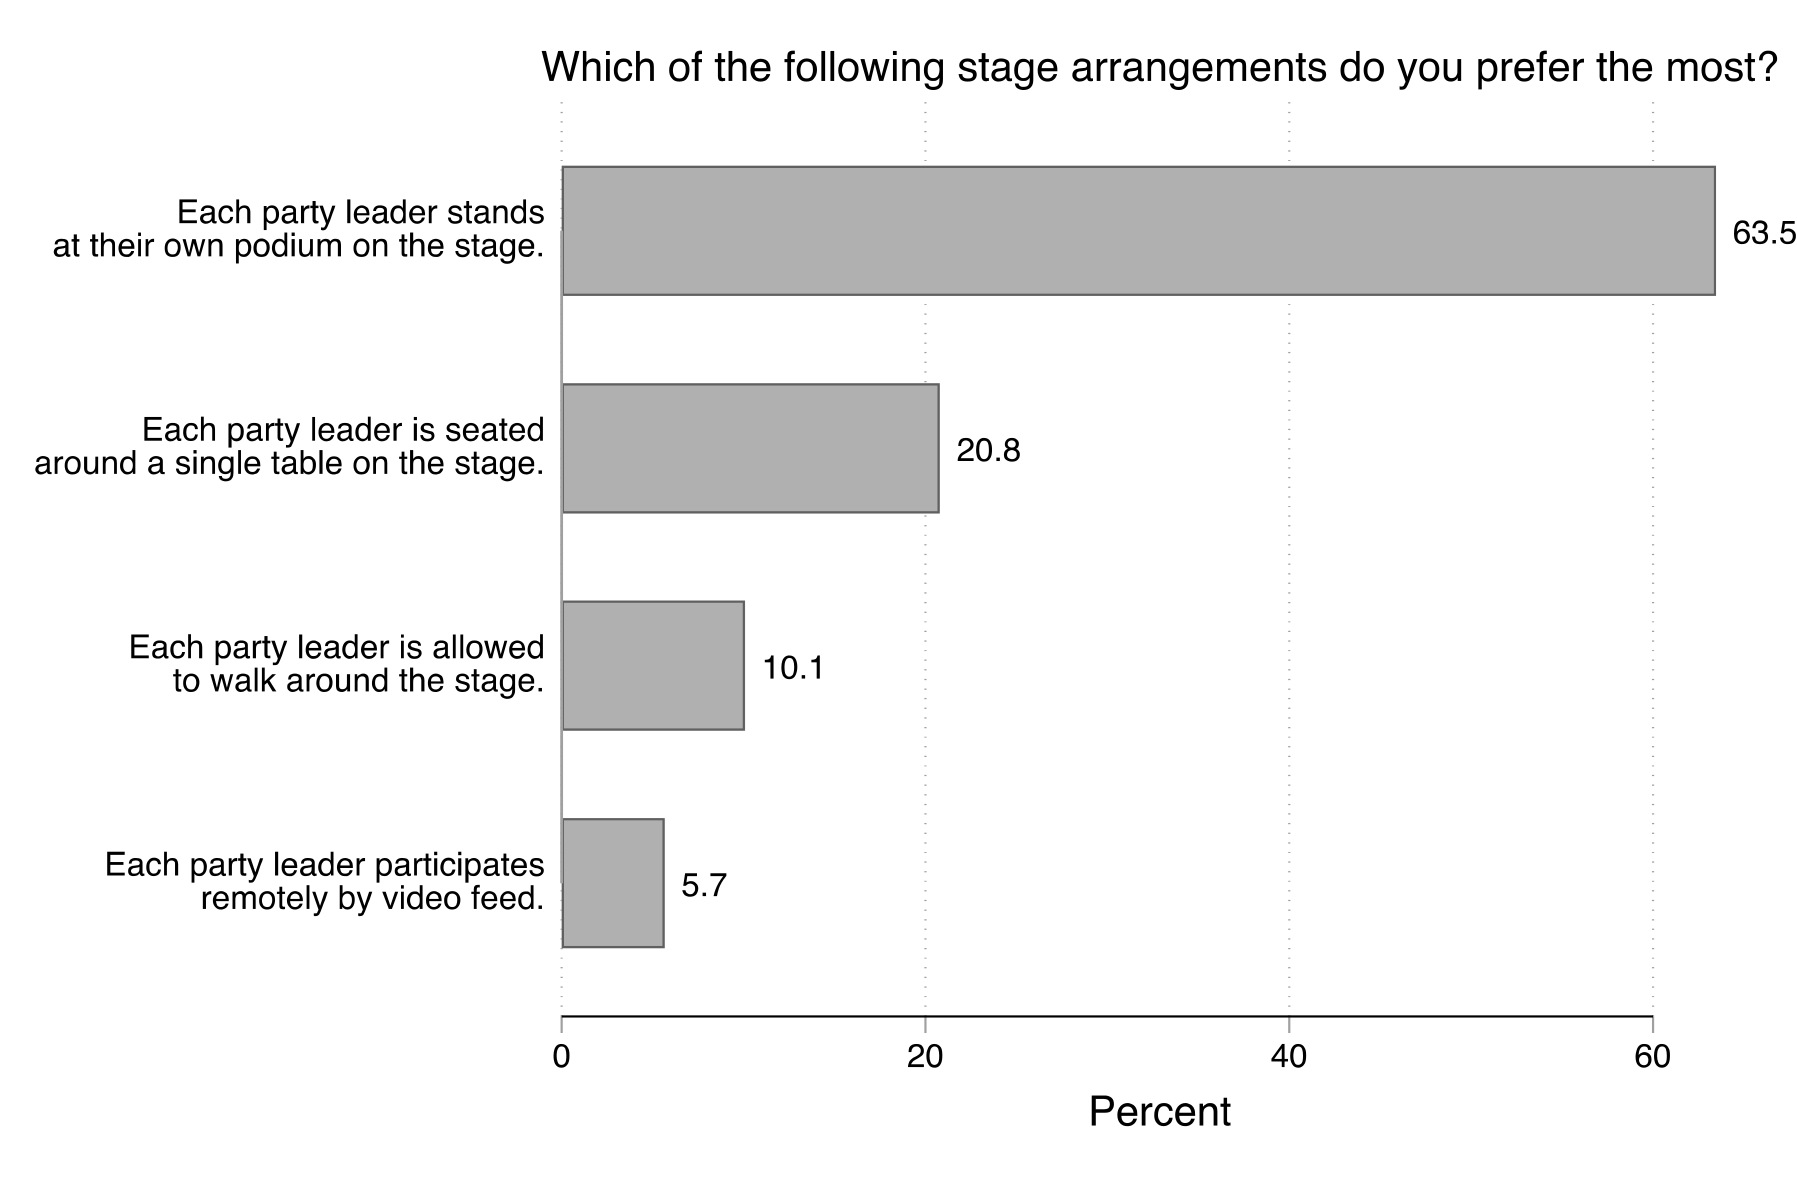
We asked Canadians how they would like the party leaders to be arranged on the debate stage. We provided four possible choices: each leader at their own podium; each leader seated around a single table; each leader allowed to walk around the stage; or each leader participating by remote video feed. Figure 40 presents the results. The clear preference, favoured by nearly two thirds (64%) of participants, was to have each party leader stand at their own podium. The least favoured arrangement was remote video feed.
4.7.8 Number of debates
The final set of findings take up the key question of how many leaders' debates to hold. As noted earlier, a single debate makes the trade-offs with respect to leader participation, topic, format, and even scheduling particularly challenging. In theory, holding more than one debate—as is done in some other jurisdictions—could go some way to relieving these tensions. Do Canadians, however, want more leaders' debates?
We tackled this question using a variety of approaches. Figure 41 reports Canadians' preferences for the number of debates in each language. Participants could choose 0, 1, 2, 3, 4, 5, or more than 5 debates. All participants were asked to choose their preferred number of English-language debates and French-language debates separately; given the intended audience of each debate, we report below the preferences for the number of English debates among English-speaking participants only and the preferences for the number of French debates among French-speaking participants only. Additionally, we randomly assigned all participants to one of three prompts about the length of the campaign. One-third was asked to make their selections when imagining that the next federal election would be five weeks long, another third was asked to imagine that it would be six weeks long, and a final third was told to imagine that it would be seven weeks long. In this way, we can examine whether citizens' preferences for the number of debates varies noticeably as a function of possible campaign lengths.
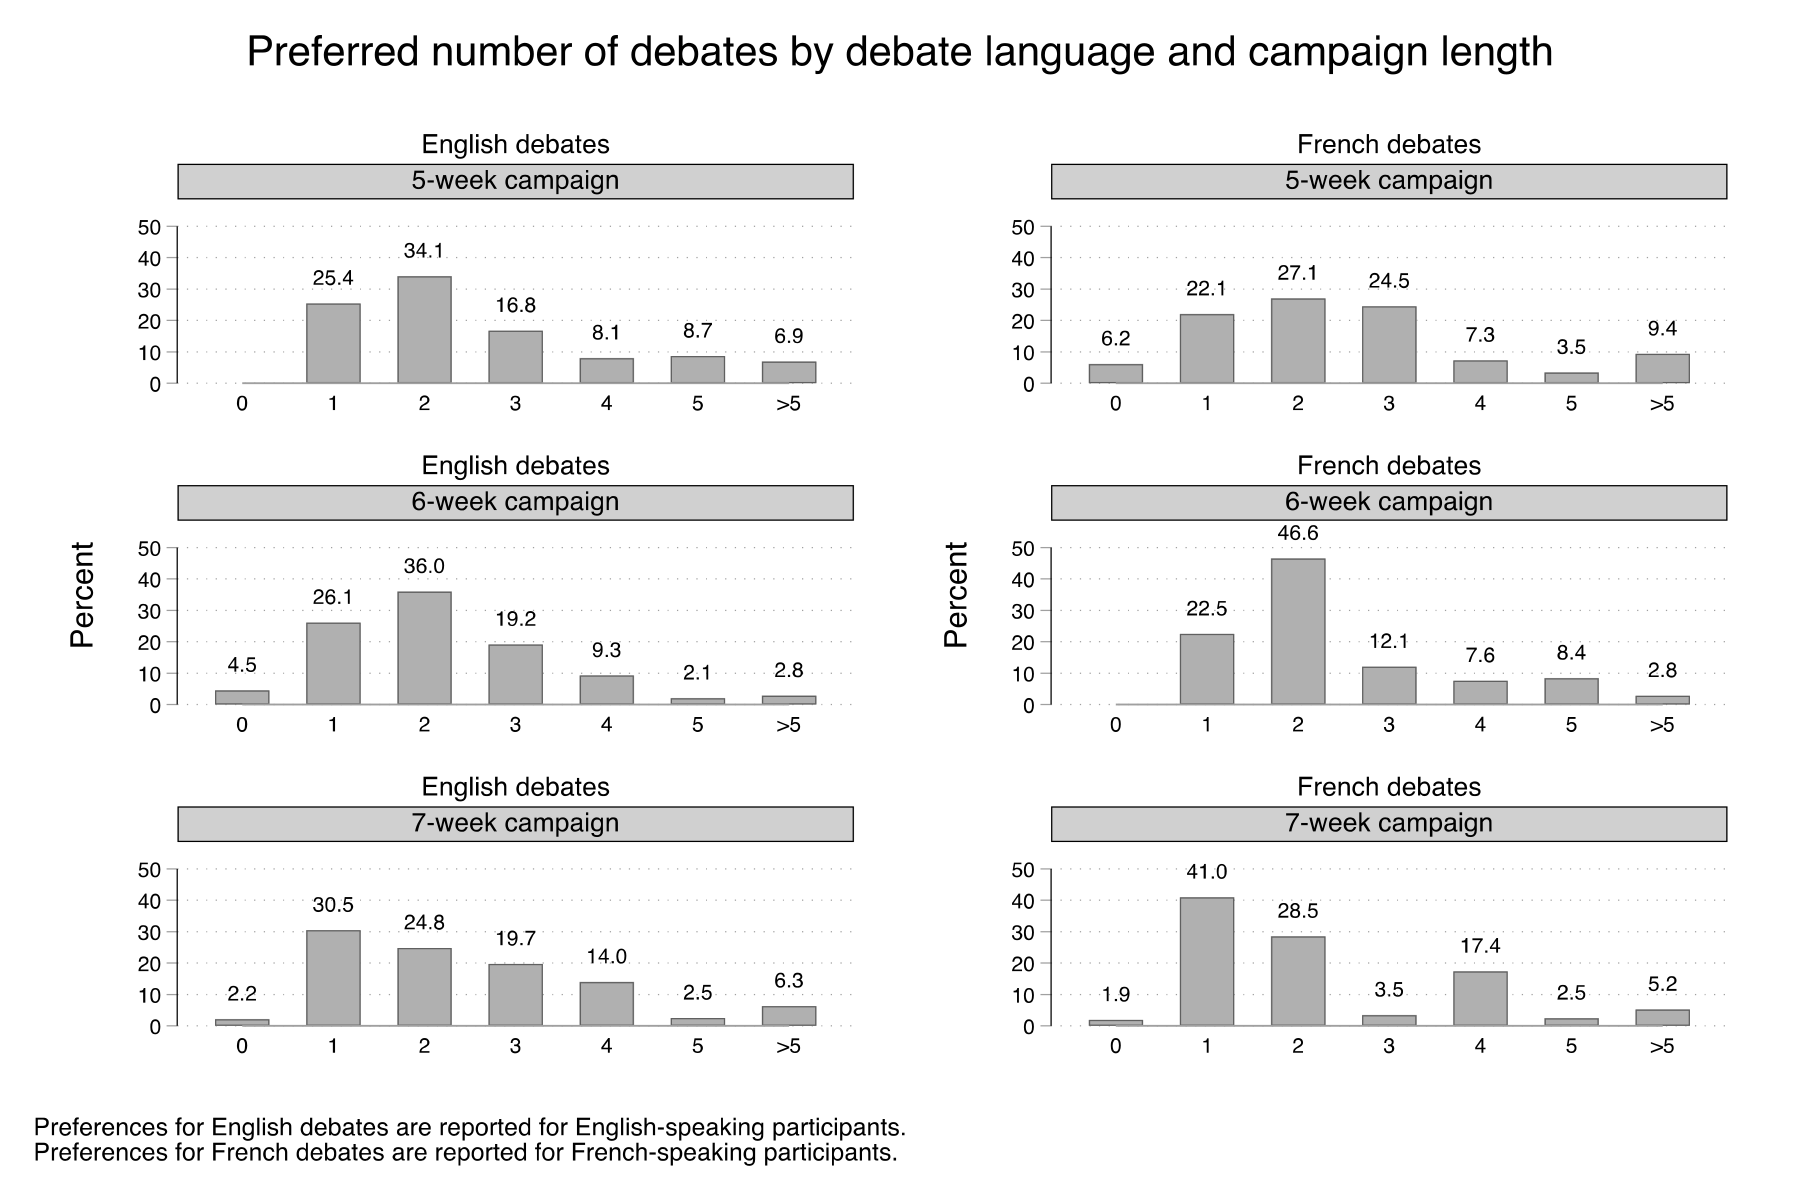
We make three main findings. First, only a very small proportion of participants wanted no debates at all. Given natural variation in political interest, as well as the negative news commentary that can sometimes accompany leaders' debates, this result is worth underscoring: the vast majority of Canadians want federal election campaigns to include leaders' debates. Second, a majority of Canadians would like to see two or more debates. In each of the six conditions, only a minority favoured one debate. Third, we do not find statistically significant evidence that campaign length influenced preferences for the number of debates. Put another way, the public demand for debates appears to be no weaker in a 5-week campaign than it is in a 7-week campaign.
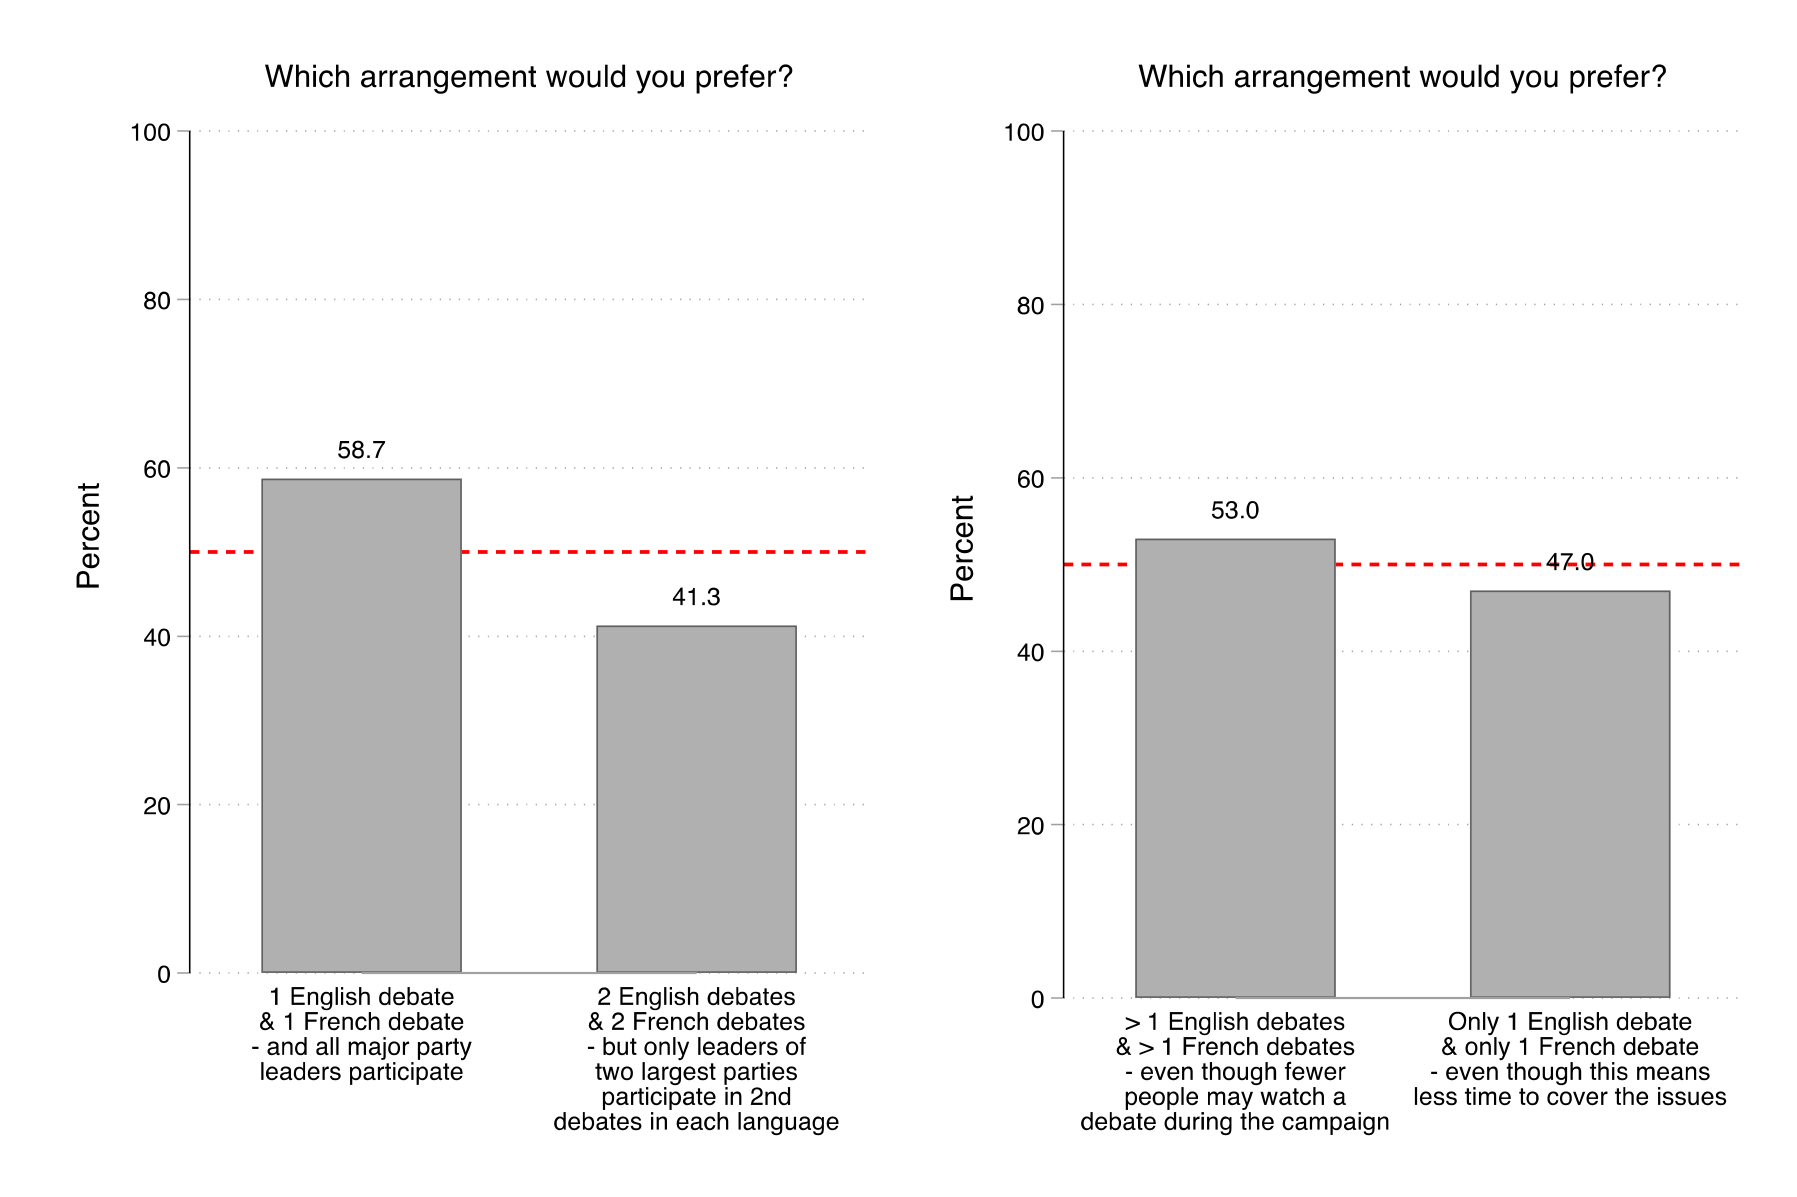
Next, we turn to exploring if these preferences for the number of debates are potentially subject to plausible trade-offs. Here we do so in the context of two binary choices, the results of which are reported in Figure 42. First, we asked participants to choose between two arrangements where: (1) there was one debate in each language and all major party leaders participated; or (2) there were two debates in each language but the second debate in each language included only the leaders of the two largest parties. Faced with this choice, a majority (59%) preferred the one-debate option to the two-debate option—again reflecting, we believe, the public's strong commitment to the wide and equal participation of party leaders noted earlier in the report.
Second, we asked participants to adjudicate the choice of one or two debates in the context of a potential tradeoff between viewership and issue coverage. Here participants were asked to choose between arrangements where: (1) there was only one debate in each language "even though this means less time to cover the issues;" and (2) there was more than one debate in each language "even though this means fewer people may end up watching a debate during the campaign." Faced with these two alternatives, a narrow majority (53%) favoured the multi-debate option. In short, we find that the public's preference for more than one debate is not unconditional—but rather subject to additional considerations, such as what form these additional debates might take.
Lastly, we tackled in greater depth the various types of debates Canadians might want in the federal election campaigns. To be sure, the norm in recent years has been a debate featuring several leaders, covering multiple issues, and including a mix of question sources—but this is not the only way to conduct leaders' debates. In theory, even in a five-week campaign, there is opportunity for a wide range of public events.
To tap the public's preferences for this wider range of event types, including events that are outside the norm of Canadian federal elections, we asked participants to imagine that they were responsible for deciding how many public events should be held in the next election campaign. They were offered the following types:
- Debates between the leaders of all major parties - covering a range of issues
- Debates between the leaders of all major parties - covering the environment only
- Debates between the leaders of all major parties - covering the economy only
- Debates between the leaders of all major parties - covering issues of particular interest to your region
- Debates between the leaders of the two largest parties only - covering a range of issues
- Public meetings where the leaders of all major parties discuss how to work together
- Public meetings between each major party leader and ordinary citizens
- Sit-down interviews between each major party leader and journalists
In addition, participants were provided with a write-in "Other" option.
Participants were told that their total selections must be between 1 and 5—meaning they could select five of just one type or distribute their selections across multiple types. The purpose of setting a maximum of five is meant to create a plausible limit on the number of major public events that could reasonably be held during a campaign and, in so doing, incentivize participants to make deliberate allocations in the face of this constraint.
Two versions of this allocation task were created: one for "English-language public events" that was administered only to English-speaking participants and one for "French-language public events" that was administered only to French-speaking participants. The results for English events and French events are reported in Figures 43 and 44, respectively. For simplicity, these results are reported in terms of the percentage who selected at least one of that event type.
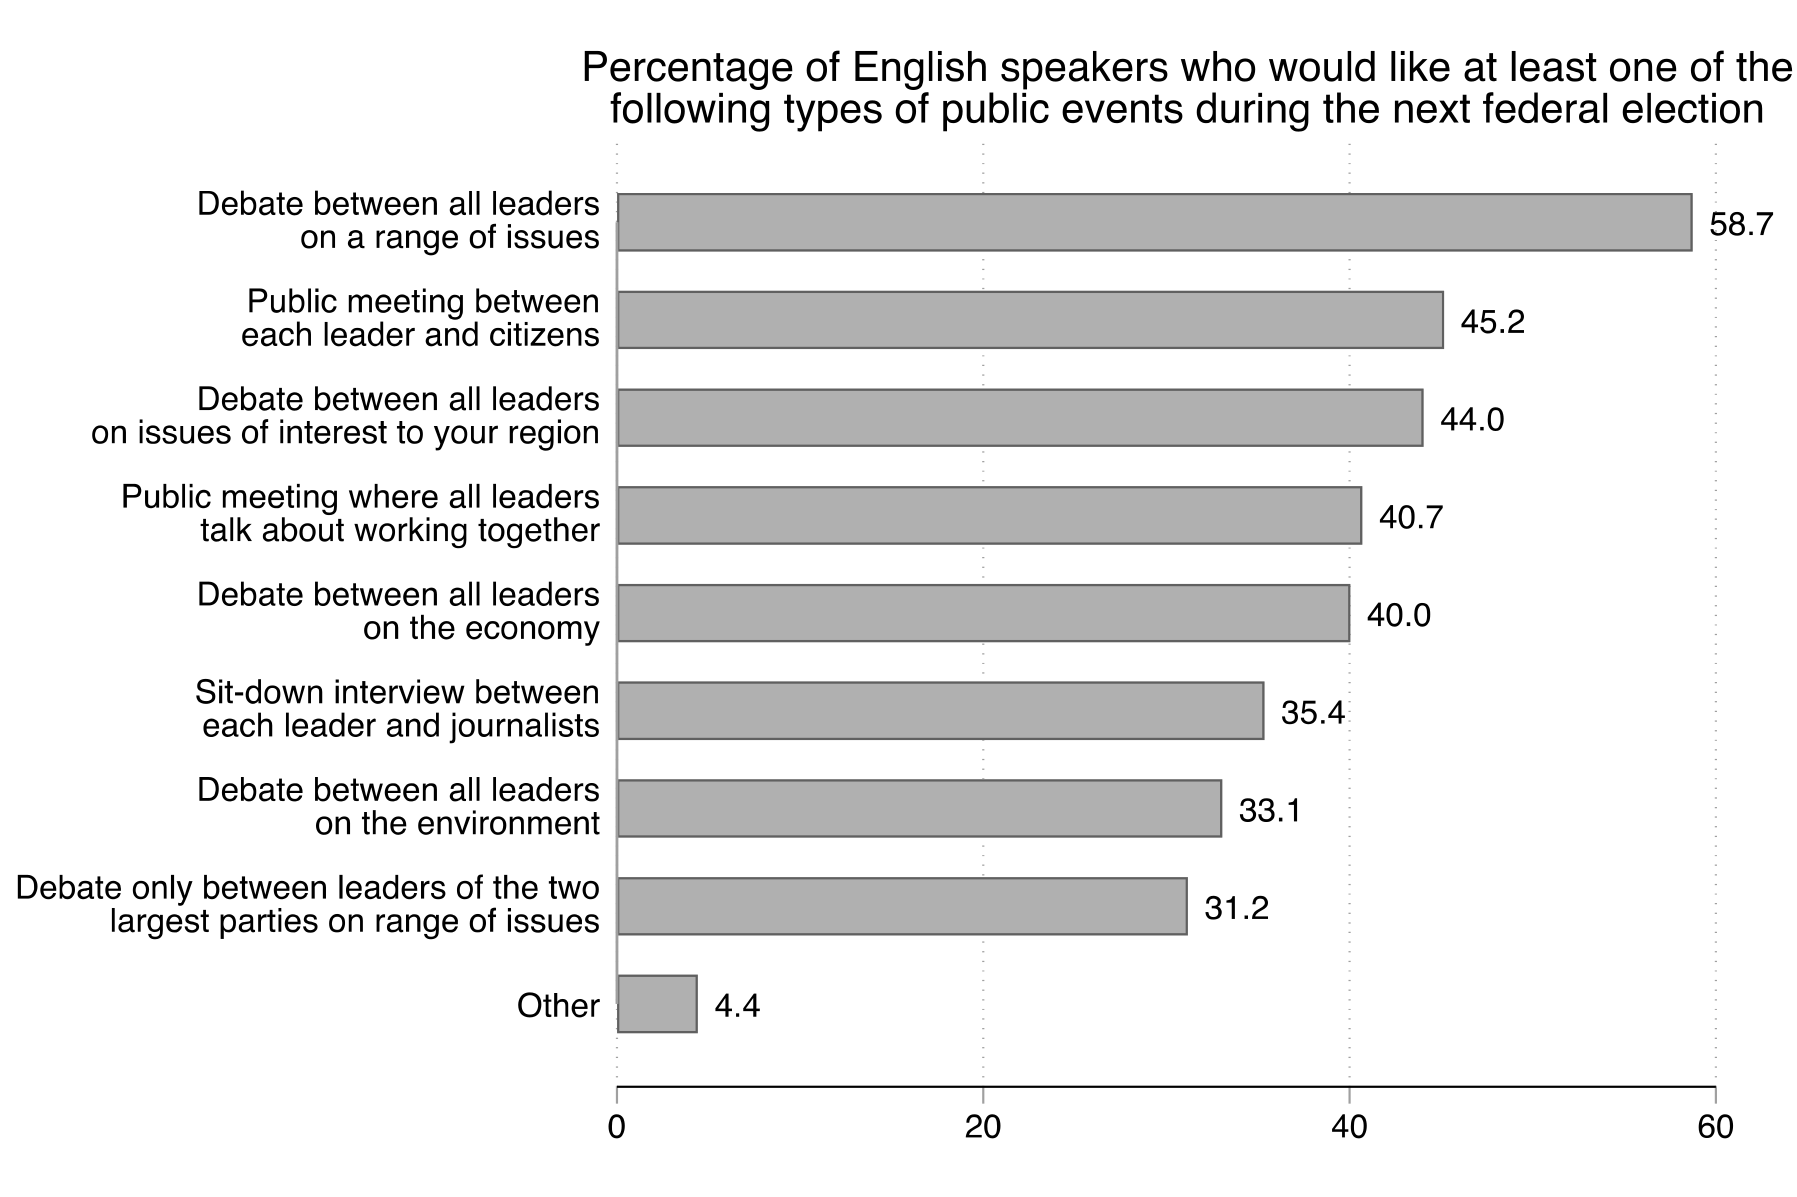
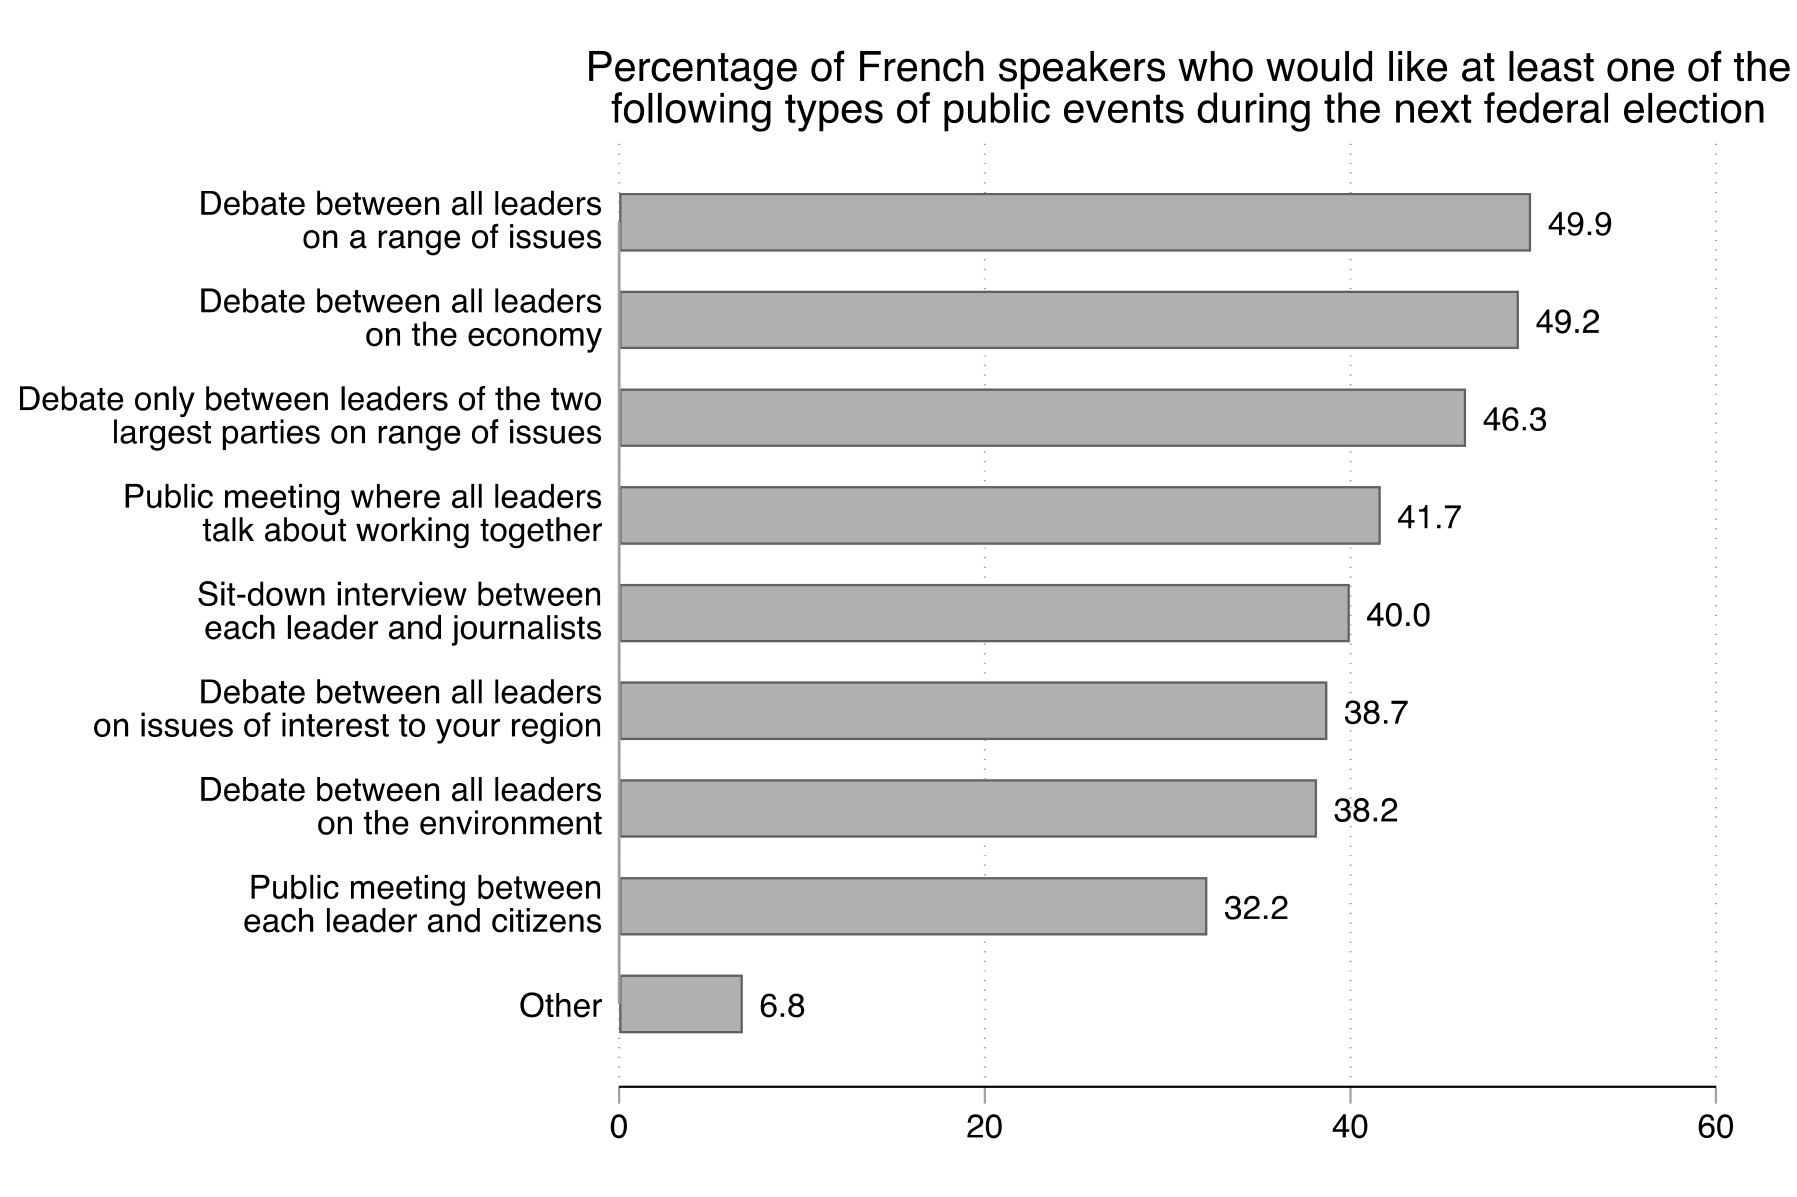
We note two key points from these results. First, the most popular selection in this choice context is also the current practice: namely, a debate between the leaders of all major parties on a range of issues. Consistent with earlier findings, a debate between the two largest parties is less popular—though 32% of English-speaking participants and 46% of French-speaking participants still indicated they wanted at least one of this type of event.
Second, there is a public appetite for a wide variety of events—including types that are not often seen in Canadian federal election campaigns. On the English events side, for example, 45% wanted at least one public meeting "between each major party leader and ordinary citizens" and 44% wanted at least one debate that covered issues of particular interest to their region. Intriguingly, 41% of English-speakers wanted at least one public meeting "where the leaders of all major parties discuss how to work together"—a type of event that runs counter to the typical cut-and-thrust of competitive election campaigns. On the French event side, the top four most popular events included this same collaborative public meeting (42%), but also an all major party debate focused on the economy only (49%) and the top-two leader debate noted above (46%).
5 Comparing the 2019 and 2021 findings
We conducted a similar study of Canadians' responses to the two 2019 Commission-organized debates. This included a three-wave survey of Canadians and a similar examination of the Twitter conversation pertaining to the debates. This similar approach—and, in several instances, identical question wordings—used in the two studies allows for some general comparisons between the 2019 and 2021 debates.
Pre-debate awareness
Both the 2019 and 2021 debates registered similarly modest levels of pre-debate awareness. While the exact question wording differed across the two campaigns, the results are broadly comparable: in 2019, we found that only 38% of participants were aware of upcoming debates; by contrast, in 2021, 40% of French-speakers had read, seen or heard something about the upcoming French debate and 26% of English-speaking participants indicated that they had indeed "read, seen, or heard" something about the English debate. Both the 2019 and 2021 debates also experienced limited anticipatory attention on Twitter.
In terms of the demographic correlates of pre-debate awareness, both the 2019 and 2021 results found that rural Canadians were less likely to be aware of the debates and older Canadians were more likely to be aware of them.
Debate viewership
The 2019 and 2021 debates all attracted significant viewership. We find, however, that viewership dropped in 2021. To facilitate comparability, we disaggregated our 2019 results by participant language. We found that 43% of French-speakers reported watching the 2019 French debate and 39% of English-speakers reported watching the 2019 English debate. As reported above in Section 4.2.1, the analogous figures for 2021 are: 32% of French-speakers reported watching the French debate and 29% of English speakers reported watching the English debate.
While we lack the necessary information to explain this roughly 10 percentage point drop in viewership, we speculate that it is likely attributable to several factors—including the COVID-19 pandemic and the scheduling of the debates. The timing of the 2021 election, for example, meant that the debates were held approximately one month earlier than in 2019 and during a week in which many Canadian families were returning to work and school following the summer break. With respect to the demographic correlates of viewership, both the 2019 and 2021 results show that official language minorities were more likely to tune in.
Viewership medium
Television was, by far, the most common way in which Canadians watched the debates in 2019 and 2021. However, we register a drop in the share of television-based viewership—and an accompanying increase in the share of online-based viewership—in 2021. For example, in 2019, 93% of French-debate viewership was through television; in 2021, this fell to 79%.
Engagement with the debates
Among French-debate viewers, the proportion who discussed the debate with others held steady between 2019 and 2021. The proportion who commented online about the debate increased from 8% in 2019 to 23% in 2021. Among English-debate viewers, the proportion who discussed the debate with others dropped from 59% in 2019 to 39% in 2021, while the proportion commenting on social media remained essentially unchanged.
Evaluations of the French debate
While majorities in both 2019 and 2021 agreed that the debate was "informative," the proportion in agreement fell from 72% to 59%. The moderation received similarly favourable evaluations in both 2019 and 2021. For example, in 2019, 77% felt that the moderator asked good questions; 80% felt the same way in 2021. Judgments of leaders' answers remained stable as well: in 2019, 41% agreed their answers were "clear;" 43% felt the same way in 2021.
Evaluations of the English debate
Majorities of viewers in 2019 and 2021 characterized the debate as "informative:" 57% in 2019 and 63% in 2021. The share of viewers characterizing the debate as "dull" also held steady: 52% in 2019 and 53% in 2021. The moderation in both the 2019 and 2021 debates was favourably evaluated. For example, in 2019, 77% of viewers felt that the moderators asked good questions and 79% felt they treated each leader fairly; the comparable figures for 2021 were 77% and 76% respectively. On the question of the number of leaders participating, 63% of 2019 viewers agreed that there were too many; in 2021, this proportion fell to 47%. (In 2021, five leaders participated—one fewer than in 2019).
The impact of the debates
We identified several positive impacts of viewership for both the 2019 and 2021 debates. With respect to political engagement-related outcomes, both the 2019 and 2021 debates generated positive impacts for news consumption about—and discussion of—the federal election. Neither had an impact on habitual news consumption more generally. Notably, the 2021 debates had a positive impact on interest in both the federal election and in politics generally; we did not find evidence of this in 2019.
For political knowledge, we found that neither the 2019 nor 2021 debates affected viewers' knowledge of salient facts about economic and social conditions or their confidence in their voting decisions. In 2019, we found that viewership was associated with greater knowledge of party platforms—a relationship we did not find in the 2021 data. In 2021, we found that viewership was associated with an improvement in the ability to rate all five leaders on the feeling thermometer scale—an outcome that was not analyzed in our 2019 report.
Regarding political evaluations, we found evidence that the debates were associated with greater updating of party ratings in 2019 but not so in 2021. By contrast, we found that the debates were associated with greater updating of leader ratings in 2021 but not so in 2019. On institutional evaluations, we found that neither the 2019 nor the 2021 debates contributed to greater political efficacy or democratic satisfaction. In 2021, however, we found that the debates contributed to increased trust in the federal government. (The institutional trust questions were new, however, to the 2021 study and thus cannot be readily compared against the 2019 results.)
Lastly, with respect to political behaviours, we found that neither the 2019 nor the 2021 debates impacted the intention to turn out to vote or the party that participants intended to vote for. The 2019 study did, however, find that debate viewership was positively associated with expectations of more non-voting forms of political participation in the future—a pattern that did not recur in 2021.
In short, there is considerable similarity in terms of what the 2019 and 2021 debates did and did not impact. Both, for example, generated greater engagement in the federal election. The two sets of debates also differed in some of their impacts but, with only two election cycles of data available, we are not able to give an account of why such differences emerged.
Public preferences about future debates
Our 2021 study provides a substantially more detailed picture of Canadians' preferences about future debates than our 2019 study. The 2019 evidence on this point is derived primarily from a conjoint experiment. The 2021 study deliberately employed a different—and, we believe, complementary—design. Thus, while the differing survey instruments do not allow for a strict apples-to-apples comparison, we nevertheless can point to some recurring patterns. In the context of a single debate, participants in both the 2019 and 2021 studies tended to favour a multi-topic format over most single-topic formats. Both sets of participants also tended to seek a place for 'ordinary citizens' to ask questions of leaders. Both sets favoured a single moderator over multiple moderators and both tended to favour a moderator that was empowered to cut off the leaders as warranted.
Appendix - Supplementary Report on Focus Groups
1. Introduction
In order to extend our understanding of debates in Canada, we also probed citizens' reactions to the 2021 leaders' debates qualitatively. We chose to conduct focus groups because they allow researchers to present a "treatment" (i.e., the debate held in their official language) to citizens and see their reactions to it. We believe this adds important nuance and completes the quantitative analysis of our report.
After describing our methodology, we present the findings from the focus groups divided into five topics: the objectives of a debate, general feelings towards the 2021 leaders' debates, perception of the leaders, the format of the 2021 leaders' debates, and perspectives on future debates.
2. Methodology
2.1 Sampling and screening
A total of four focus groups were conducted, of which two were related to the English language leaders' debate and two to the French language leaders' debate. In each case, the focus group was directed in the language of the debate: that is, the two English focus groups discussed the 2021 English language leaders' debate and the two French focus groups discussed the 2021 French language leaders' debate. The English language focus group was moderated by Peter John Loewen, professor of political science at the University of Toronto. The French language focus group was moderated by Allison Harell, a professor of political science at the Université du Québec à Montréal.
The first English language focus group was held on December 15th, 2021, and the second on December 16th. The French language focus groups took place on December 17th as well as 20th, 2021. The focus groups lasted 90 minutes. A total of 18 adults were interviewed (9 in each language). Participants were recruited through a commercial firm so as to be broadly representative of the population in terms of age, region, and gender and racial identity. Some—but not all—participants reported watching a 2021 debate prior to attending the focus groups, which provided valuable variation during the ensuing discussions.
2.2 Procedure
Each focus group was held on Zoom, and all followed the same procedure. After entering the meeting, participants were welcomed by the moderator and asked to present themselves (first name only). The session was divided into three sections. First, in the introduction, the moderator explained that the focus group aimed to better understand the views of Canadians about debates. After defining what a debate is, participants were asked: what should the goals of a debate be? Following this discussion, the session turned towards the 2021 debate and asked the group their initial reactions or impressions to the 2021 debate that was held in their language.
Second, we presented four video clips of the 2021 debate (i.e., the 2021 debate held in each group's official language) and asked participants to react to what they watched. We collected a total of eight segments, four from the English language debate and four from the French language debate. The clips ranged between four and eleven minutes in length.Footnote 1 For example, one video clip presented a question from a citizen on climate change followed by a head-to-head exchange between Mr. Trudeau and Mr. O'Toole on the same topic. After watching each clip, the moderator asked to group their thoughts on the clip, as well as semi-directed questions regarding the format and structure of the debate. This section aims to show particular moments from the debate where some features of the debate format are salient. All debate sections were covered by the four clips (open-debate, head-to-head, citizen question, journalist intervention, etc.). Therefore, the clips were selected to represent the different portions of the debate, as well as the differences in interactions between candidates.
The last section was on what leaders' debates could be. In other words, we asked participants to think of what the ideal debate looked like for them. To help them to structure their opinions, we presented a few pairs of alternatives (also asked in the third wave of the survey) on debate structure. For example, we asked participants if they preferred debates with more parties or fewer parties.
The focus groups were recorded, and an anonymized transcript of the discussions was created following the sessions. The analysis below is based on these written transcripts. The reported results are built on recurring observations from participants' responses, such as areas of consensus and differences of opinions.
3. Findings
3.1 The goals of a debate
We identified three main goals that synthesize participants' views. First and foremost, the majority of participants said that they want to learn about the party platforms and policy propositions. For instance, a participant said that "the objective, I think, is to express and clearly show what their projects are, and what they are going to do for us." Therefore, citizens want to know what the parties propose and how it can affect their lives. This observation also speaks to the results from the third wave of the survey, where we find that the top-ranked goal for a leaders' debate is to learn about party platforms (see Figure 29).
Second, participants expressed a desire to learn about each leader's character and personality. We observe that they want to hear and see how a leader answers questions, reacts under pressure and interacts with others. For example, someone noted that "it's really important to see how they interact, how they get along because when there are bigger issues on the table." Hence, participants want to understand who the leaders are and how they can fit in a position such as Prime Minister that needs certain traits and skills. Further, we also observe that they want to know the leaders' values. For the participants, values are tied to their policies and their behaviours during a debate. This also relates to the survey, where we find that 11% of the participants ranked "learning about party leaders" as the most important goal of a debate (see Figure 29).
Finally, the participants noted that the questions of a debate must be oriented towards the first two goals. They said that questions should be relatively hard but, most importantly, that they must be specific to ensure that leaders' responses are not vague. This relates to the idea that they want details on the platforms and how the leaders interact without watching a discussion where leaders talk over each other.
3.2 General feelings about the 2021 leaders' debates
Participants who saw the 2021 leaders' debates prior to attending the focus group expressed relatively positive feedback about them. They thought the debates were well structured and that the leaders were respectful and polite (particularly in the French language debate). For instance, a participant notes that he "found that it [the debate] was much more sugar-coated, very calm, very respectful." Further, after viewing the clips and discussing it with the groups, a participant said that watching the debate helped open the electorate's perspectives. They note that hearing the responses from the leaders directly helps them understand who the leaders are and if they want to vote for them or not.
Further, participants felt that the questions were not specific enough. Some participants argued that some questions were too broad, which caused the answers to be vague. However, it is important to note that several participants thought that the interventions and questions from the journalists were especially interesting because they were very clear and specific.
3.3 Perceptions of the leaders
Party leaders were obviously at the center of the video clips. Hence, participants expressed thoughts on their general behaviours within the structure of the debate. We observe two distinct reactions. On the one hand, a number of citizens expressed political reactions to what the leaders were discussing during the videoclips. We interpret this as a natural response and a sign that participants were engaged in watching the clips. The discussions between the leaders are important because they help citizens understand the party policies and how these fit with their own beliefs.
On the other hand, participants also expressed frustration towards some leader behaviours. They were irritated by two elements. First, they thought that the leaders were not answering questions. Most participants in the focus groups thought leaders were too vague in their answers and that the moderator could have intervened more to make sure leaders answered these questions.
Second, participants disliked when leaders spoke at the same time or when they interrupted each other. Although some participants pointed out that leaders must challenge their opponents, most participants found this situation confusing. Further, they express that when leaders talk over each other, it is hard to get information and they lose interest. For example, a participant said that this situation is "confusing. I don't understand anything anymore when they are all talking. And, yeah, it's frustrating when they are just, [..] kind of fighting with one another. […] I find it hard to follow, […] of who is saying what." Another individual adds that they "feel like no one was able to get their point across and [are] left feeling more confused than when [they] came in." It is key for citizens to understand the information they are getting and participants made clear that exchanges when multiple leaders are talking at once prevents them learning this information.
3.4 Format of the 2021 leaders' debates
3.4.1 Number of leaders
When asked about the number of leaders that should be present on stage, participants preferred having fewer than five parties. Indeed, several participants thought that only the three biggest parties should be invited. For them, this proposition is motivated by the idea that they want to see candidates that have "a chance of being Prime Minister." For instance, a participant said regarding the present format: "we miss out on what the people who actually might occupy the Prime Minister's job, what they have to say, and listen to [other] people."
Yet, other participants pointed out that they appreciate the current format. According to them, it is important to hear a diversity of views on several issues—even if the leader is unlikely to become Prime Minister. Hence, the interventions of the smaller parties, by their questions and policies, enhance the learning of watchers. Moreover, some citizens noted that their inclusion is also good for accountability.
3.4.2 Number of debates
Most participants seem to agree that having more debates that focus on specific issues—or at least on fewer issues per debate is preferable. Citizens think that having more debates will help leaders to add more details to their propositions and policies. Hence, they could gain greater information from the questions of the moderator. This echoes the results from the survey, where we find that participants want two or more debates. We learned with the focus group that what might drive this preference is the desire to have clear and detailed answers to questions and to policy proposition of the parties. Some participants, however, expressed some reluctance about multiple debates because they found a format with only one debate easier to follow. Further, a participant pointed out that—in a campaign with multiple debates—a citizen might choose one debate over another because of its content, which might reduce learning in domains that might not be salient to this individual. In other words, having one debate on a wide variety of issues encourages citizens to think about a wide range of general issues.
3.4.3 Time allocation
We highlight two themes from the focus groups regarding time allocation during the debates. First, people generally thought that leaders did not have enough time to speak about their policies. Participants would have liked to see the leaders explain in detail their propositions. As noted in Section 3.4.2, participants would like to see more time devoted to each issue—even if it means that more debates are organized. For instance, a participant notes that "there's not enough time […]. When they start [… speaking of] their platform, there's really no detail or follow up on those." Furthermore, they feel that the leaders could be more specific but that the debate structure prevents them from doing so. Indeed, a participant said that "it seems like they're just rushing through everything and no one's really getting the answers."
Second, participants in the focus groups expressed a strong preference towards the equal distribution of time between the leaders. Fairness was at the center of this view. Participants thought that all leaders should have the same amount of time to express their ideas. Yet, some respondents also said that they like discussions between leaders and that it might mean that some leaders have a little less time to speak. Overall, the discussion in the focus group demonstrates that participants tend to prefer equal speaking time between leaders but that the enforcement of this rule should not be too strict.
3.4.4 Moderator
Participants particularly appreciated the role of the moderator during the 2021 leaders' debates. Indeed, very few participants had negative comments regarding moderator interventions and questions. Participants generally thought that the moderators were important to guide discussions and make sure questions were answered.
Importantly, participants were in favour of the various interventions made by the moderators in the debates. They thought that the moderator should cut off leaders—either to make sure that leaders answered a question or to ensure equal speaking time between leaders. That said, some participants found the moderator interventions confusing at times because leaders could not end their sentences, which made their responses less clear to participants.
Overall, participants felt that the moderator should play a central role. It is important that they intervene when necessary to re-direct the discussion towards the question or make sure that the debate was structured and respectful.
3.4.5 Journalists
People in the focus group also liked the interventions of the invited journalists. They thought it was a good addition to the moderator questions. Specifically, they appreciated the fact that the journalist questions were specific to each leader's policy propositions. As one participant noted, these were: "an interesting opportunity to […] get a little bit deeper on some of the issues and questions […]." The general feeling was that journalists' questions enhanced learning of party propositions and ideas. Further, participants liked that the different journalists challenged the leaders on their responses (although some participants thought some were a little too aggressive). Overall, participants found that journalists' questions relevant and important to have a better understanding of the party platform.
3.4.6 Citizens' questions
Citizens' questions are another segment that the participants in the focus groups liked. Participants thought this format was clear and particularly relatable since a citizen like them asked a simple and concise question. They also appreciated the format where each leader directly answers the question—though they would have liked to see more time for each of these leader responses. As one participant notes, "it makes it more relatable to hear somebody, […] from our level to be able to speak their voice and hopefully represents a lot of people in Canada who also have that same question."
Participants expressed a desire to see more questions from regular citizens. They proposed to add questions from citizens in the debate. They also thought it would be interesting to let the citizen ask a follow-up question based on leaders' responses.
3.5 Future debates
At the end of each focus group, we asked participants about what their ideal debate would look like. Two further themes stood out. First, participants said that they felt lost at the start of the 2021 leaders' debates because the structure was unclear to them and they did not know where the parties, broadly speaking, stood regarding policy. One focus group proposed having some kind of introductory segment where each leader can present what they stand for generally—before answering questions. In other words, participants felt that the start of the debates were abrupt and that an introduction to the parties would have helped them gain a better understanding of the platforms. A discussion between three participants (anonymized as P1, P2, and P3) from a French focus group illustrates this point:
"P1: My idea is for each leader to prepare a video capsule with the points of interest that the party wants to develop and a summary of promises, which are then presented each at a time. […]
P2: I wasn't thinking a video but a presentation with bullet points [… of the] subjects that are important to them […]. So we already have an idea of what is going to happen, which questions are going to be asked and all that; not just presenting a debate out of the blue. Not everybody follows the news, not everybody follows what parties present and what they want to do. I think that for the general public, it would be nice to have a presentation and then have the debate.
P3: […] It would be nice to have that at the beginning because I don't follow the news very much, so I quickly read what they have to present, very quickly, so at least if there were videos, I think I would follow the debate and I would watch it because it would be simple. We would know what we are working towards […]. With explanatory videos, and then a debate, […] I could make a better, more informed, choice."
We interpret this as a desire among some participants to first get a sense of what the parties propose in order to later learn as much as possible from the debate questions. Several participants felt that their limited prior knowledge of party platforms prevented them from fully benefiting from the debate questions.
Second, participants express some interest in varying who gets to ask questions during a debate. Although participants like the roles the moderators performed during the 2021 leaders' debates, they also said that they would like to see more questions from regular citizens because they are more relatable.