
Evaluation of the 2019 Federal Leaders' Debates
John R. McAndrews1, Aengus Bridgman2, Peter John Loewen1, Daniel
Rubenson3, Laura B. Stephenson4, and Allison Harell4
1University of Toronto
2McGill University
3Ryerson University
4Western University
5Université du Québec à Montréal
January 19, 2020
Table of Contents
- 1. Executive summary
- 2. Introduction
- 3. Summary of overall findings
- 4. Methods
- 5. Debate awareness
- 6. Debate evaluation
- 7. Debate Consequences
- 7.1. Interest in federal election and in politics generally
- 7.2. News consumption
- 7.3. Knowledge
- 7.4. Self-reported confidence in knowing enough to vote
- 7.5. Democratic satisfaction
- 7.6. Confidence in democratic institutions
- 7.7. Political efficacy
- 7.8. Discussion of federal election
- 7.9. Turnout intention and vote choice
- 7.10. Party Evaluations
- 7.11. Evaluations of the party leaders
- 7.12. Non-voting forms of political participation
- 8. Future debates
- References
- Appendices
- A Responses from survey fielded through Commission website
- A.1 Debate viewership
- A.2 Viewership medium
- A.3 Viewed with others
- A.4 Discussed debates with others, including on social media
- A.5 Reasons for not watching the debates
- A.6 Evaluation of debate content and format
- A.7 How to select which leaders to invite to participate in debates
- A.8 Requirement for broadcasters to carry debates
1. Executive summary
Our research team was tasked by the Leaders' Debates Commission to undertake a comprehensive analysis of the impact of the leader's debates organized in the 2019 Canadian federal election. We worked with the Commission to identify the impacts they were interested in assessing. We then independently designed and analyzed a series of surveys of Canadians. Our findings concerning the impact of the debates follow in this report.
Our summary conclusion is that the debates had a positive impact on the election. The debates were widely viewed, on both traditional and social media. They increased Canadians' engagement with the election by increasing the attention paid to the election and by increasing democratic discourse between citizens about the election. We further find that the debates helped Canadians clarify the positions of the parties on key election issues. In short, the debates were an instrument for improving democracy. Taking into account the views of Canadians, we conclude the Commission conducted a series of informative, high-quality debates, in keeping with their mandate.
Our report also contains several important insights on how debates can be conducted in the future. We see value in ongoing research efforts to better understand the role that leaders' debates play in our democracy. We believe this report provides a useful framework for doing so–including greater use of panel-based survey designs to assess the impact of debate watching and survey-based experiments to elicit Canadians' preferences about debate formats.
2. Introduction
The 2019 Canadian federal election featured two official leaders' debates, organized by the Leaders' Debates Commission. The Commission is an organization mandated by the Government of Canada to convene debates during federal elections. The 2019 election was the Commission's first, effectively replacing an ad hoc system of debate organization. As part of its mandate, the Commission is to submit a report to Parliament.
This study is drafted in support of the Commission's report. Our aim is to provide an even-handed, data-driven assessment of the 2019 Commission debates so as to inform policy makers going forward on the practice of holding leaders debates during elections. In what follows, we present results from a multi-wave survey of several thousand Canadians, as well as a social media analysis of hundreds of thousands of Canadians.
3. Summary of overall findings
In working with the Commission, we were asked to provide data-based insights on nineteen questions. Below, we present each question, followed by a response and a summary of the relevant results from our report.
- Are the debates associated with increases in information and factual knowledge, such as increased understanding of the parties' positions, increased information on where and how to vote, etc.?
We fail to find that the debates were associated with increased information about when and how to vote. We do, however, find that debate viewers, compared to non-viewers, showed significant increases in their knowledge of party promises and positions.
- Are the debates associated with increases in participation, conversation, engagement, and interest in politics, as a result of watching the debates and/or discussing the debates with others?
We find substantial evidence that the debates were associated with increases in participation, conversation, and engagement. Specifically, while we do not find an increased likelihood of voter turnout as a result of watching the debates, we do find that debate watchers became more likely to say they would participate in non-voting forms of political participation (e.g., attending a political meeting, using social media to discuss politics, or signing a petition) over the next 12 months. We also find that debate watchers displayed a significant increase in their news consumption about the federal election following the debate, compared to non-viewers. Further, we find that–again compared to non-viewers–debate viewers reported substantially greater increases in their discussion of the federal election with others. Finally, we find that the days where the most discussion of Canadian politics was observed on Twitter were those immediately following the two debates.
- Are the debates associated with an increase in positive democratic attitudes, such as a belief that democracy is the best system for choosing leaders, satisfaction with democracy, and higher levels of internal and external democratic efficacy?
Our study does not provide evidence of either systematic positive or negative effects of debate viewership on support for democracy or individual senses of efficacy.
- Are the debates associated with knowledge of and changes in views of the parties, leaders, and their policies?
We find some evidence that the debates were associated with changes in views of the parties, leaders, and their policies. In particular, we find that viewers were better able to identify party positions as a result of watching the debate. We also find that debate viewers changed their ratings of the parties and their leaders more than non-viewers.
- Did the Commission ensure the delivery of two informative debates of high journalistic quality?
Recognizing the important role of journalists and media critics in answering this question, our report only provides a partial answer. As noted above, we find evidence that the debate was both informative and that it spurred discussion and greater news consumption. On these scores, it generated a more engaged and informed audience. As to the debate format itself, we find that a majority of viewers of the English and French debates agreed that the debates were informative, aided them in better understanding the issues at hand, and in understanding differences between the parties.
Viewers told us that they believed moderators treated leaders fairly, that they asked good questions, and that they gave leaders enough time to answer questions. On the other hand, there is some evidence that viewers would have preferred leaders had more time to debate one another, and that moderators could have pushed leaders harder to provide factual answers and to not avoid answering questions.
- Did the Commission ensure that as many Canadians as possible had access to the debates?
We find clear evidence that debate-based content following the broadcasts was widely consumed–both on traditional media and social media. To the degree that the debates were not consumed, it was likely a function of interest. The Commission can aim, however, for an improvement in public awareness of the debates in the days leading up to the debates, especially among those in harder-to-reach communities–such as disabled Canadians, racialized communities, rural residents, and younger Canadians.
- Were the debates organized in the public interest and in a cost-effective manner?
We find that the debates had a wide reach across multiple platforms. Given that the debates were carried by multiple broadcasters and widely pushed across social media channels and given that viewers themselves indicated that they found the debates informative, we conclude that the public interest was well-served. While we cannot comment directly on costs, our findings that the debates did have an effect in increasing information and news consumption in an already highly saturated information environment suggests that they were effective.
- Did the Commission respect its guiding principles of independence and impartiality, transparency, credibility, democratic citizenship, civic education and inclusion?
Taking all of our findings together, we would on balance conclude that the Commission conducted a series of informative, high-quality debates, in keeping with their mandate. Viewers were largely happy with the performance of the moderators, especially when asked if the moderators were fair and posed good questions. We find evidence that citizens were more informed by viewing the debates, and more engaged politically following them. On measures of inclusion, our findings are mixed. We find lower reported awareness of the debates (in the days leading up to the debates) among disabled, non-European, and rural Canadians, as well as among younger individuals. With respect to eventual viewership, however, we find no clear evidence that disabled Canadians, Canadians of non-European ancestry, or rural Canadians were less likely to watch. We do find that younger Canadians were less likely to report watching the debates.
- What was the survey-based estimate of viewership of the debates?
According to our survey estimates, approximately 40% of Canadians watched the debates.
- How important were the debates to the 2019 electoral process?
A broad view of our evidence suggests that the debates were central to the electoral process. First, they were widely viewed by Canadians, both through traditional media and social media. Second, they served an important role in clarifying party positions. Third, those who watched the debates report greater discussion and news consumption. Fourth, we present evidence that those who watched the debates also updated their views of the parties and their leaders. On balance, the debates played an important role in increasing engagement with the issues, leaders, and choices before voters.
- How effective was the Commission's public outreach strategy?
We find that awareness of the debates before they aired was limited. Only 38% of Canadians were aware of the debates, and of that group, just 24% and 8% knew the dates of the English and French debates, respectively. With greater resources, the Commission may be able to reach a larger group of Canadians.
- What was the quality of the Commission's two debates in terms of broadcast and journalistic standards, format and content?
We find substantial agreement that the debates were well-moderated, with some room for improvement in encouraging leaders to be more forthright. To the degree that Canadians express reservations about debate content, it is more attributable to their evaluations of the conduct of party leaders than the moderators or the format.
- Did the debates take optimum advantage of both traditional and new media?
We find that while the debates were overwhelmingly consumed over television, many Canadians viewed or listened to the debates online or over the radio. We also find that the debates dominated social media channels on the days they were broadcast, suggesting substantial reach across traditional and new channels.
- Did the debates meet the objective of reaching out to Canadians with disabilities, indigenous groups, remote communities, linguistic minorities and ethno-Canadian communities?
We find lower reported awareness of the debates among disabled Canadians, Canadians of non-European ancestry, and rural Canadians. We do not find lower reported awareness among Indigenous peoples or among official language minorities. In addition, we find no clear evidence that eventual viewership was lower among these groups. We note that these findings should be treated with caution, however, given the limits of survey research among smaller groups in the population.
- Did the debates help Canadians make informed voting decisions and/or contribution a meaningful way to Canadians' knowledge and voter turnout?
We find evidence in our report that the debates increased news consumption and discussion, both well-known antecedents to vote choice. We also find that the debates clarified party positions among voters, while also allowing them to better update evaluations of leaders. We find no direct effect on voter turnout, however.
- Were the debates perceived as reinforcing trust in democracy/democratic institutions?
We find no evidence that the debates increased Canadians' evaluations of or trust in Canadian democratic institutions.
- Did the debates contribute to Canadians' perceptions of feeling more confident/secure in their voting decisions?
While we find evidence that Canadians were informed by the debates (i.e., in terms of objective indicators of their knowledge of party promises), we do not find a difference between debate viewers and non-viewers in terms of change in self-reported confidence in knowing enough to vote.
- What are the perceptions of Canadians with regards to leader participation in leaders' debates?
When asked directly, we find that the majority of viewers of the English debates believed there were too many leaders participating. Viewers of the French debate do not agree with this sentiment, with a majority disagreeing that too many leaders participated. When we later present respondents with a number of scenarios to measure their preferred debate format, we find that respondents are indifferent to the number of leaders participating. On balance, then, the number of leaders allowed to participate is not a settled question among Canadians.
- What are the views of Canadians with regards to whether broadcasters should be compelled to carry leaders' debates?
When asked directly, we find that a clear majority of Canadians believe that TV broadcasters should be compelled to carry the debates.
4. Methods
For each of the preceding questions, we marshal either survey data, social media data, or both. Our survey research relies on a three-wave study of a broadly representative sample of Canadians. Our social media analysis relies on text-as-data analysis of more than 19 million tweets about the Canadian election from 1.1 million Twitter accounts tweeting on Canadian politics.
4.1. Survey methodology
The survey portion of our study relies on a three-wave survey conducted during and after the election. We partnered with a leading sample provider – Dynata – to create a broadly representative online sample of Canadians.
Our initial survey wave was conducted in the week before debate week, i.e. from October 1 to October 7 (the last response to the first wave was completed shortly before the English debate began at 7 pm ET on October 7). Three-thousand seven-hundred individuals completed this wave. Our second wave commenced on October 8, the morning after the English debate, and closed on Oct 18. Respondents from the first wave of the survey were invited to complete this survey. We issued sufficient invitations such that 2,420 respondents completed this wave. Of these 2,420 respondents, 1,809 completed the survey after the English debate but before the French debate, while 611 completed the survey after both the English and French language debates. A third wave of the survey was conducted shortly after the election, commencing on October 24 and ending on October 29. We issued invitations to respondents to our second wave survey such that 1,013 completed the third wave.
In partnership with our survey sample provider, the first wave of our survey was sampled from online panels with quotas for age, gender, and province. We also employed a quota for official language. Our second and third waves were sampled in a convenience framework from previous wave responses, with the exception of a quota for official language.
Post data collection, to further improve the representativeness of our inferences, we generate a separate IPF or "raking" weight for each wave of the survey using the ipfweight command in STATA 15. Marginal values were successively weighted according to observed census levels on age, gender, immigration status, and province, as well as voter turnout in 2015. For each weight, a maximum of 100 iterations were made. Weights were bounded at 0.2 and 5.
4.2. Social media methodology
Twitter data used in this report was collected from August 1, 2019 to October 21, 2019. The objective of the Twitter data collection effort was to capture all major party candidates, major news organizations, as many Canadian journalists as possible, and a broad swath of the public conversation. Journalists and media organizations were identified using an iterative approach that began with a core seed list of all Members of Parliament, the Twitter handles of all declared candidates, and approximately 300 journalists, academics and news outlets validated by a Canadian politics media expert. Additional accounts were added throughout the election based on frequency of posting on Canadian election related themes and mentions to and from existing tracked accounts. This algorithm yielded approximately 5000 likely accounts of interest, each of which were reviewed manually for Canadian politics relevance and then tracked. This yielded a total of 3889 explicitly tracked accounts, of which 830 are journalists, 272 are official accounts of news outlets, 1280 are candidates of major parties, and 1507 are third-parties (a broad category including provincial politicians of note, registered third-party advocacy groups, academics, and public users of Twitter with many followers).
To supplement this elite-oriented collection effort, we gathered a list of Canadian Politics hashtags. We used a similarly iterative strategy and began with a list of 33 well known Canadian Politics seed hashtags. This list was expanded in an iterative manner based on hashtag co-occurance and frequency of use by our existing tracked users on a weekly basis throughout the entire campaign. 1854 hashtags were identified in this manner, and then manually reviewed to identify their Canadian politics relevance. This yielded a list of 544 Canadian Politics hashtags. A full list of handles and hashtags tracked is available upon request.
There are other social media on which Canadians discussed the election. These include Facebook, Instagram, YouTube, Reddit, Tumblr, 4Chan, Parler, Gab, and many more. This report draws exclusively upon Twitter data given that it is almost entirely publicly available and was able to be accessed by the report team. Other social media sites may offer additional insights beyond those on Twitter, and further research should be done to evaluate the extent to which the findings on Twitter are reflective of the broader online community and the Canadian public more generally.
For sentiment analysis, the Lexicoder dictionary is used (Young and Soroka 2012) for English-language texts, and a French-language translation is used for French-language texts (Duval and Pétry 2016). These tools identify a set of positive and negative word tokens that can be measured over a set of texts to classify those texts as generally negative or positive in tone. The proportion of positive to negative words allows the overall tone of a set of texts to be identified in an automated manner. We show how this dictionary-based approach meets expectations in Figure 7 and then apply it to a number of debate-related tasks.
4.3. Estimation strategies
Our essential empirical strategy to detect "debate effects" with our survey is to compare changes in opinions and views between survey waves. For most of the questions we address, then, we leverage changes between Waves 1 and 2, comparing those who did and did not report watching the debates. This is effectively the well-known "difference-indifference" approach to estimate debate effects. For other quantities, such as estimates of debate viewership, or one-time retrospective evaluations of debate format, we simply rely on frequencies observed within a discrete survey wave.
5. Debate awareness
Prior to the debates, we find relatively modest levels of awareness of the Commission debates. In the days leading up to the debates, we asked respondents in Wave 1 whether they knew if there were any more scheduled debates. As shown in Table 1, more than half of respondents were unaware of any upcoming debates.
In addition, we asked respondents who indicated that they were aware of upcoming debates if they knew the date of the English debate (Table 2) and the French debate (Table 3). In both instances, relatively few of these respondents were able to identify the correct dates.
|
|
Percent |
Standard error |
N |
|---|---|---|---|
|
Unaware |
62.41 |
0.90 |
1938 |
|
Aware |
37.59 |
0.90 |
1373 |
|
Total |
100.00 |
0.00 |
3311 |
Survey responses are weighted (see Methods for details). 90 percent of sample randomly assigned to this question.
|
|
Percent |
Standard error |
N |
|---|---|---|---|
|
Incorrect |
75.81 |
1.23 |
1032 |
|
Correct |
24.19 |
1.23 |
341 |
|
Total |
100.00 |
0.00 |
1373 |
Survey responses are weighted (see Methods for details). Question only administered to participants who thought there were upcoming debates.
This comparatively low level of awareness about the leaders' debates was similarly found in social media discussions. We searched all tweets for "debate" and "débat" to show the frequency of discussion on the debates over the course of the campaign. Figure 1 shows debate mentions across the platform from the beginning of the campaign to one day before the English-language debate. The two non-Commission debates hosted by Maclean's and TVA saw same and next-day spikes that quickly fell off. The week before the first Commission debate did not see a large increase in anticipatory attention.
|
|
Percent |
Standard error |
N |
|---|---|---|---|
|
Incorrect |
91.33 |
0.82 |
1257 |
|
Correct |
8.67 |
0.82 |
116 |
|
Total |
100.00 |
0.00 |
1373 |
Survey responses are weighted (see Methods for details). Question only administered to participants who thought there were upcoming debates.
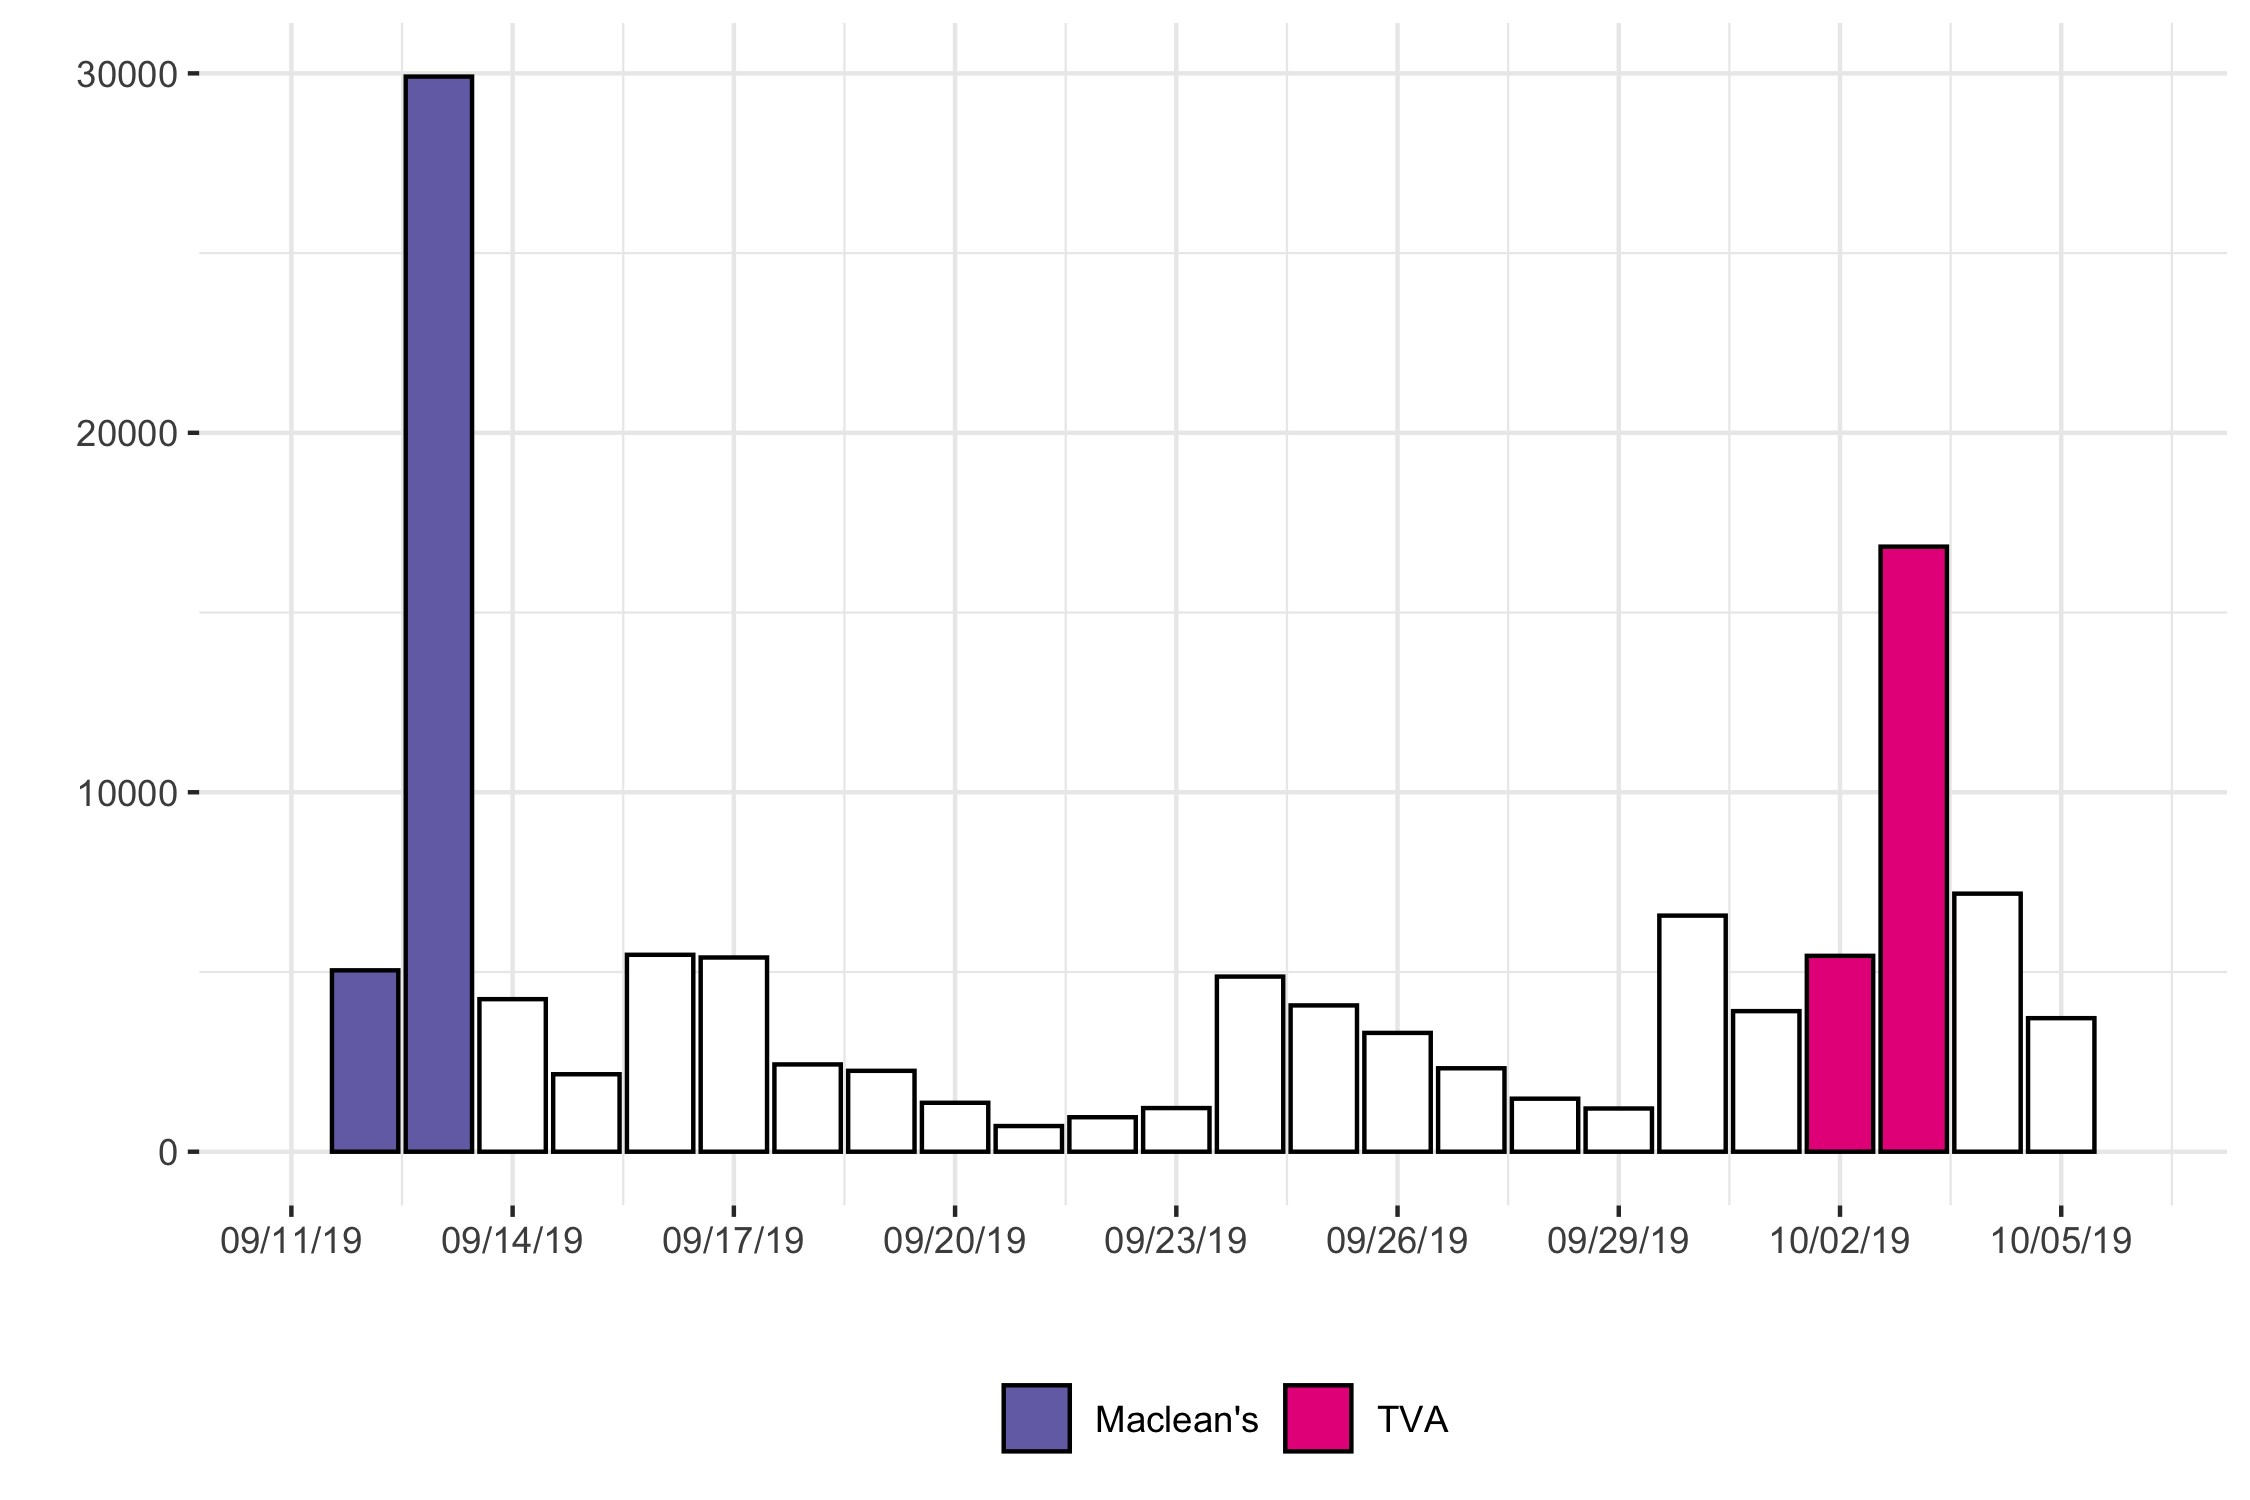
Figure 1: Debate-related Twitter activity prior to the Leaders' Debates Commission events
5.1. Debate viewership
Despite the levels of knowledge and anticipation regarding the Commission debates, actual viewership of the debates was significant. In Wave 2, we asked all respondents whether they watched the English debate on October 7: 37% said they did (Table 4). In addition, as of October 10, we asked respondents whether they watched the French debate: 41% said yes (Table 5).Endnote [1]
|
|
Percent |
Standard error |
N |
|---|---|---|---|
|
Did not watch |
63.45 |
1.10 |
1439 |
|
Watched |
36.55 |
1.10 |
963 |
|
Total |
100.00 |
0.00 |
2402 |
Survey responses are weighted (see Methods for details).
|
|
Percent |
N |
|---|---|---|
|
Did not watch |
59.25 |
362 |
|
Watched |
40.75 |
249 |
|
Total |
100.00 |
611 |
Question administered to respondents who completed the survey after the start of French debate. Survey responses are unweighted.
5.1.1. Twitter viewership
To evaluate Twitter engagement, we looked at so-called "second-screeners" or those that posted on social media about the debates during the debates themselves. Figure 2 shows the percentage of users that were active during the debates (October 7th from 7 to 9 EDT and the 10th from 8 to 10 EDT.) that directly engaged with the debates through a relevant hashtag or keyword, by language of debate and language used by the Twitter user. For the English-language debate, approximately 65% of English-language Canadian Politics Twitter users engaged with the debate and approximately 51% of French-language users did the same. For the French-language debate, only 33% of English-language users "second-screened" whereas 61% of French-language users did.
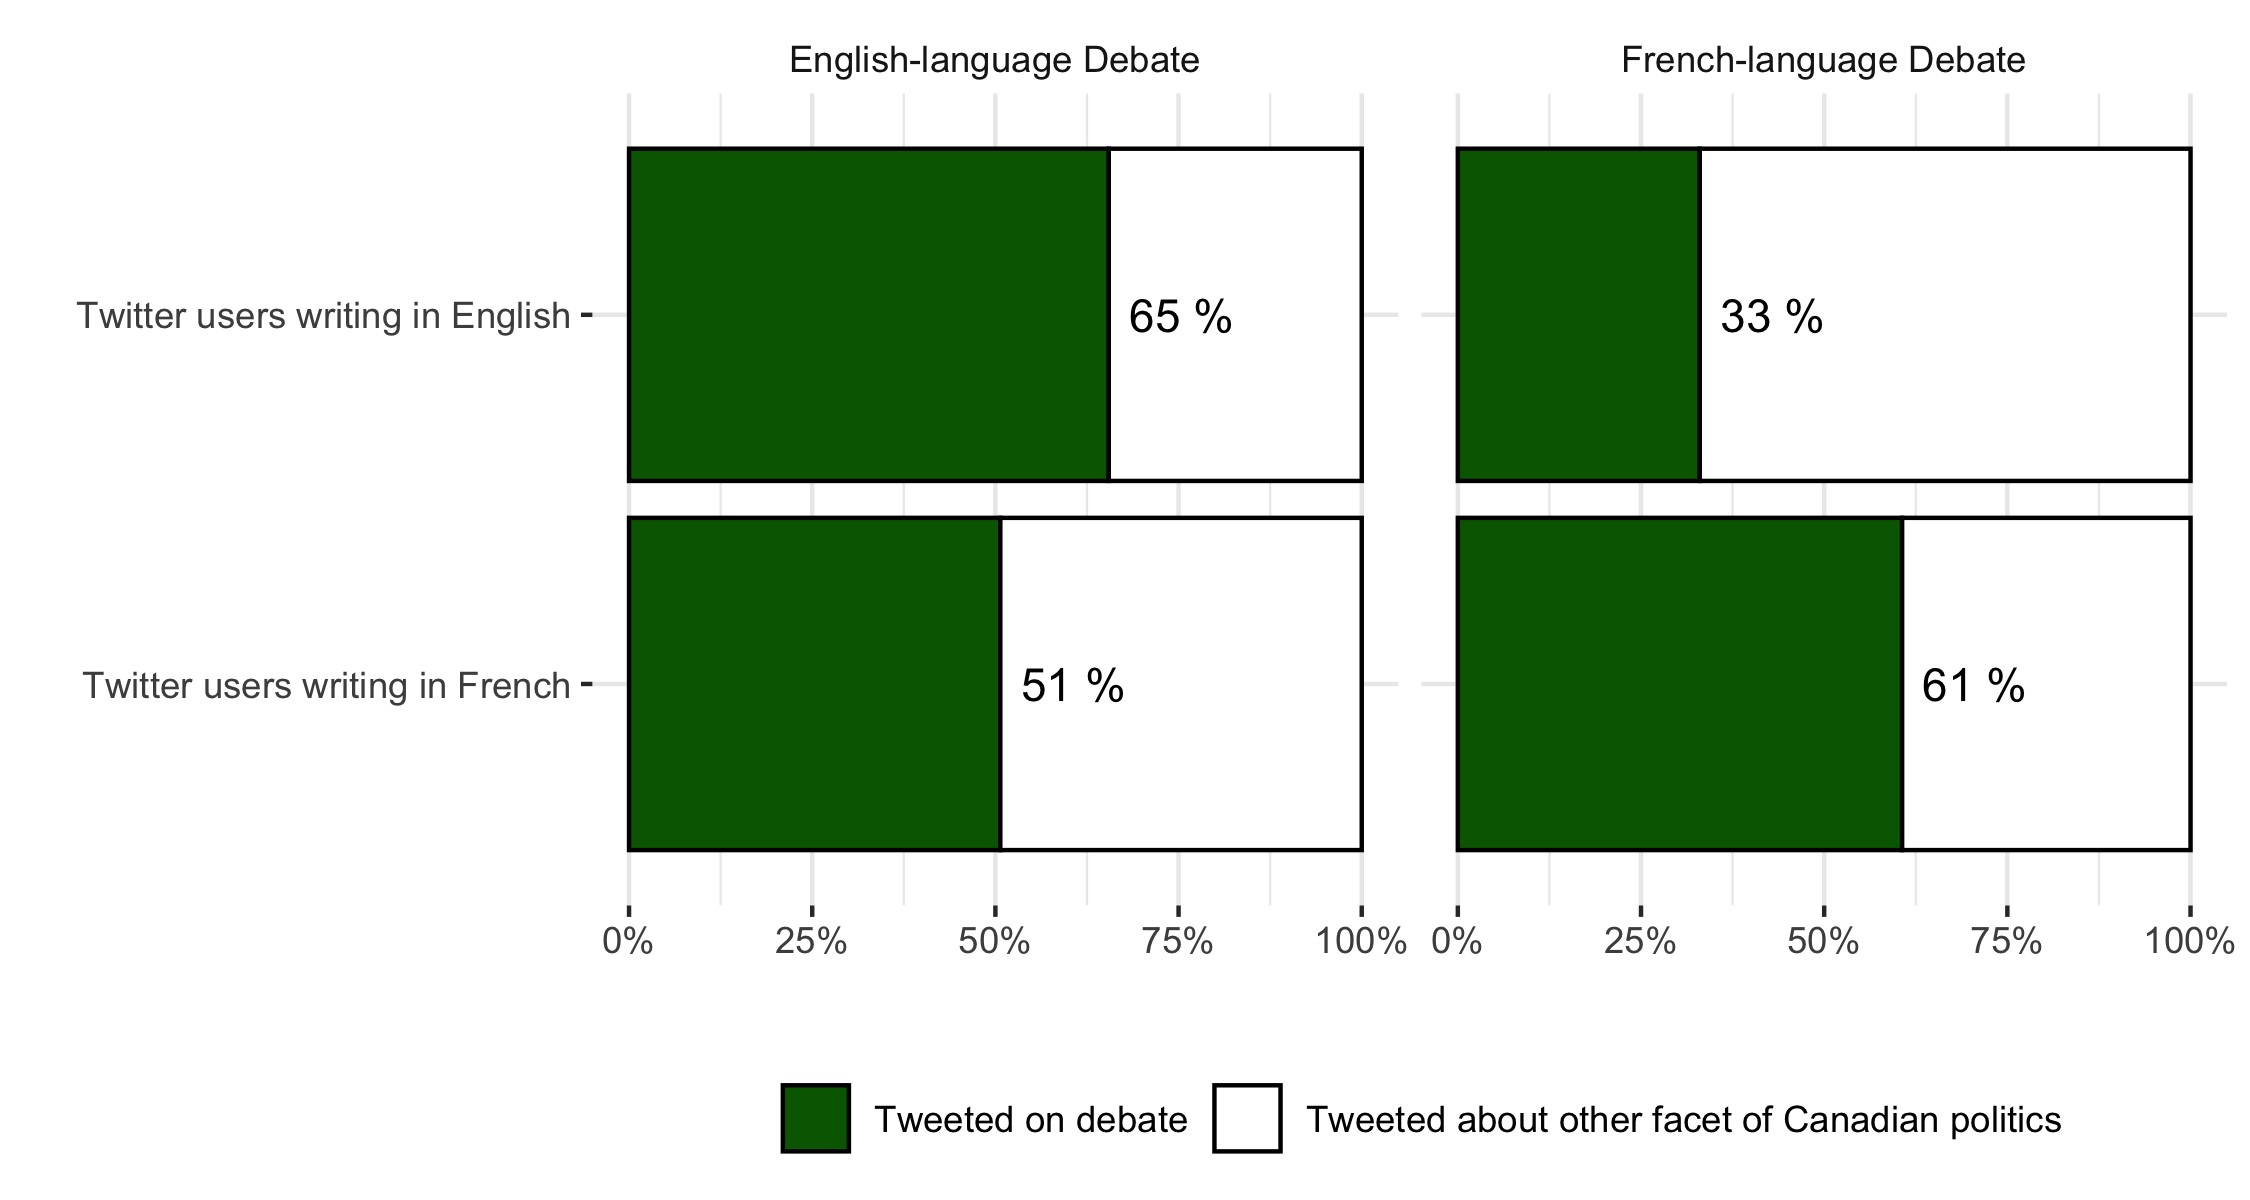
Figure 2: Debate-related Twitter activity during English-language debate
A different measure is to look at the politics-related conversation during the two debates on Twitter and see the extent to which the debates were the subject of tweets. Figures 3 and 4 show the debate-related activity during the two debates. The debates are divided into their thematic areas by time stamp, with the faded-out bars representing the total volume of Canadian politics-related tweets during the debate time. Approximately 40% of the discussion on Canadian political Twitter during the debates was explicitly about them, and the volume of conversation increased during the debate.
As expected, the same comparison for the French-language debate shows high engagement, with a full 47% of French-language Twitter activity explicitly focused on the debates during those two hours, with much of the surrounding volume also driven by the debate. Figure 4 shows the volume of activity during the debate, by theme, as compared to the overall level of activity on French-language Canadian politics Twitter.
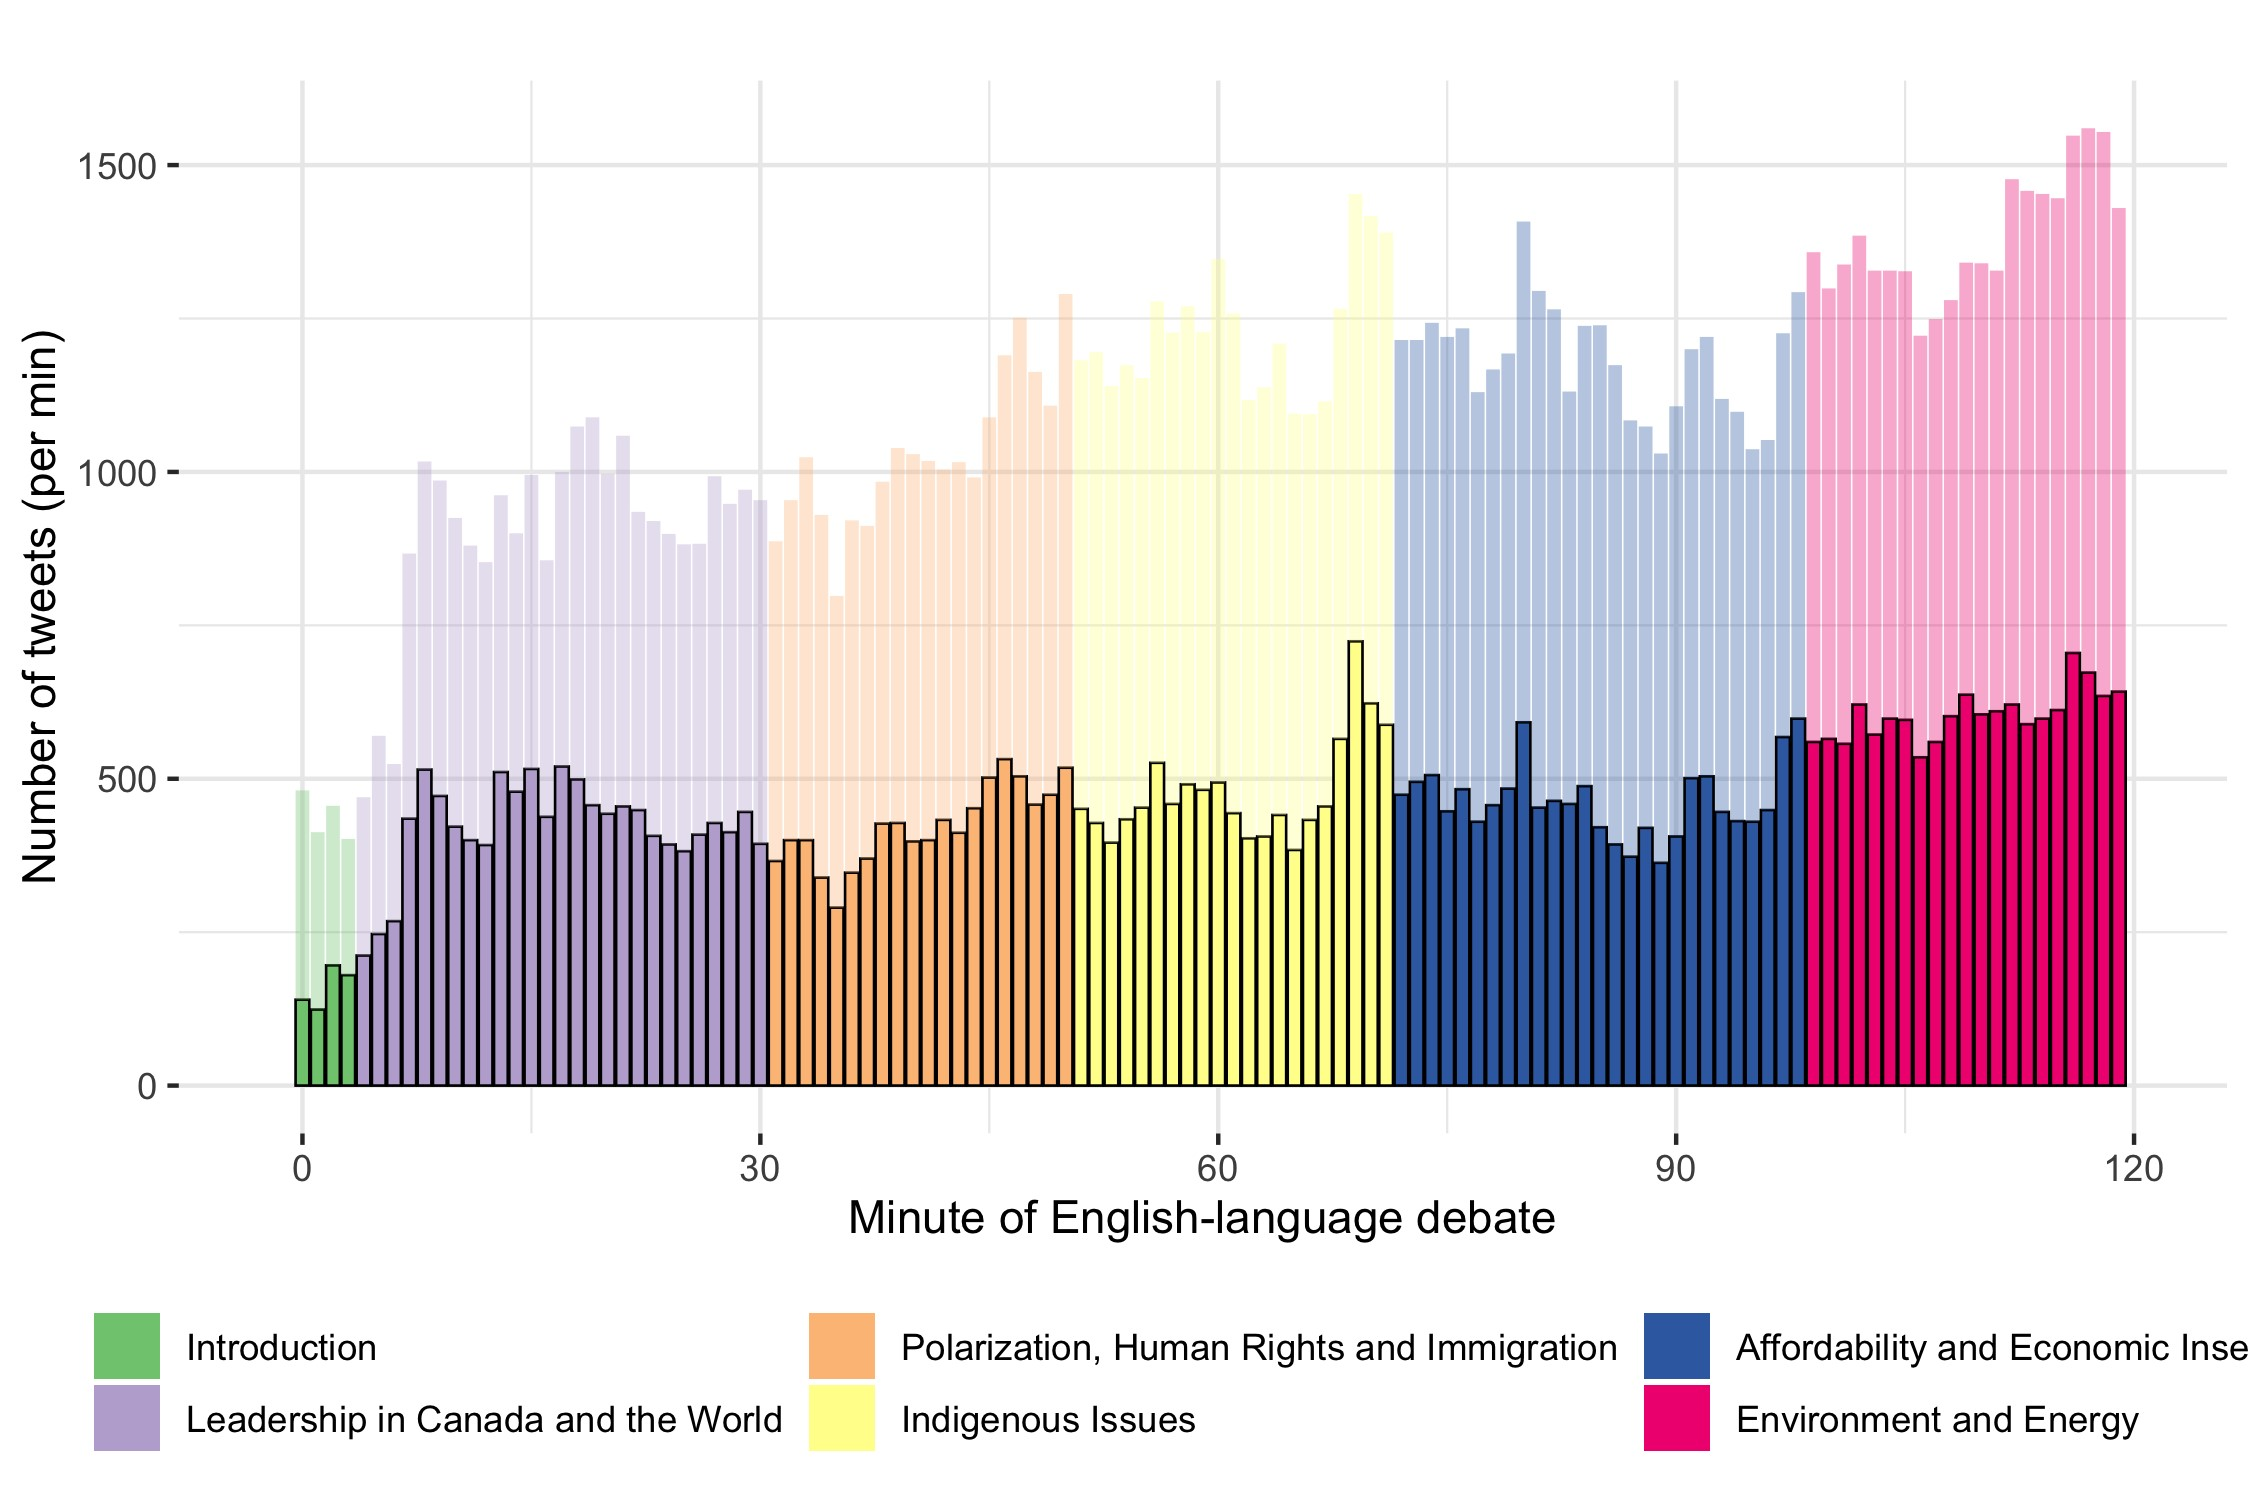
Figure 3: Debate-related Twitter activity during English-language debate
A final measure concerns those on Twitter who most actively follow Canadian politics. Here we examine only those who follow 5 or more candidates and/or Canadian politics journalists, who tweet regularly on Canadian politics, and who were active around the week of the debate. Of the 15 751 users that fit that criteria, 55% tweeted about the debates. The debate was well watched and commented by those who are among the loudest in online Canadian politics.
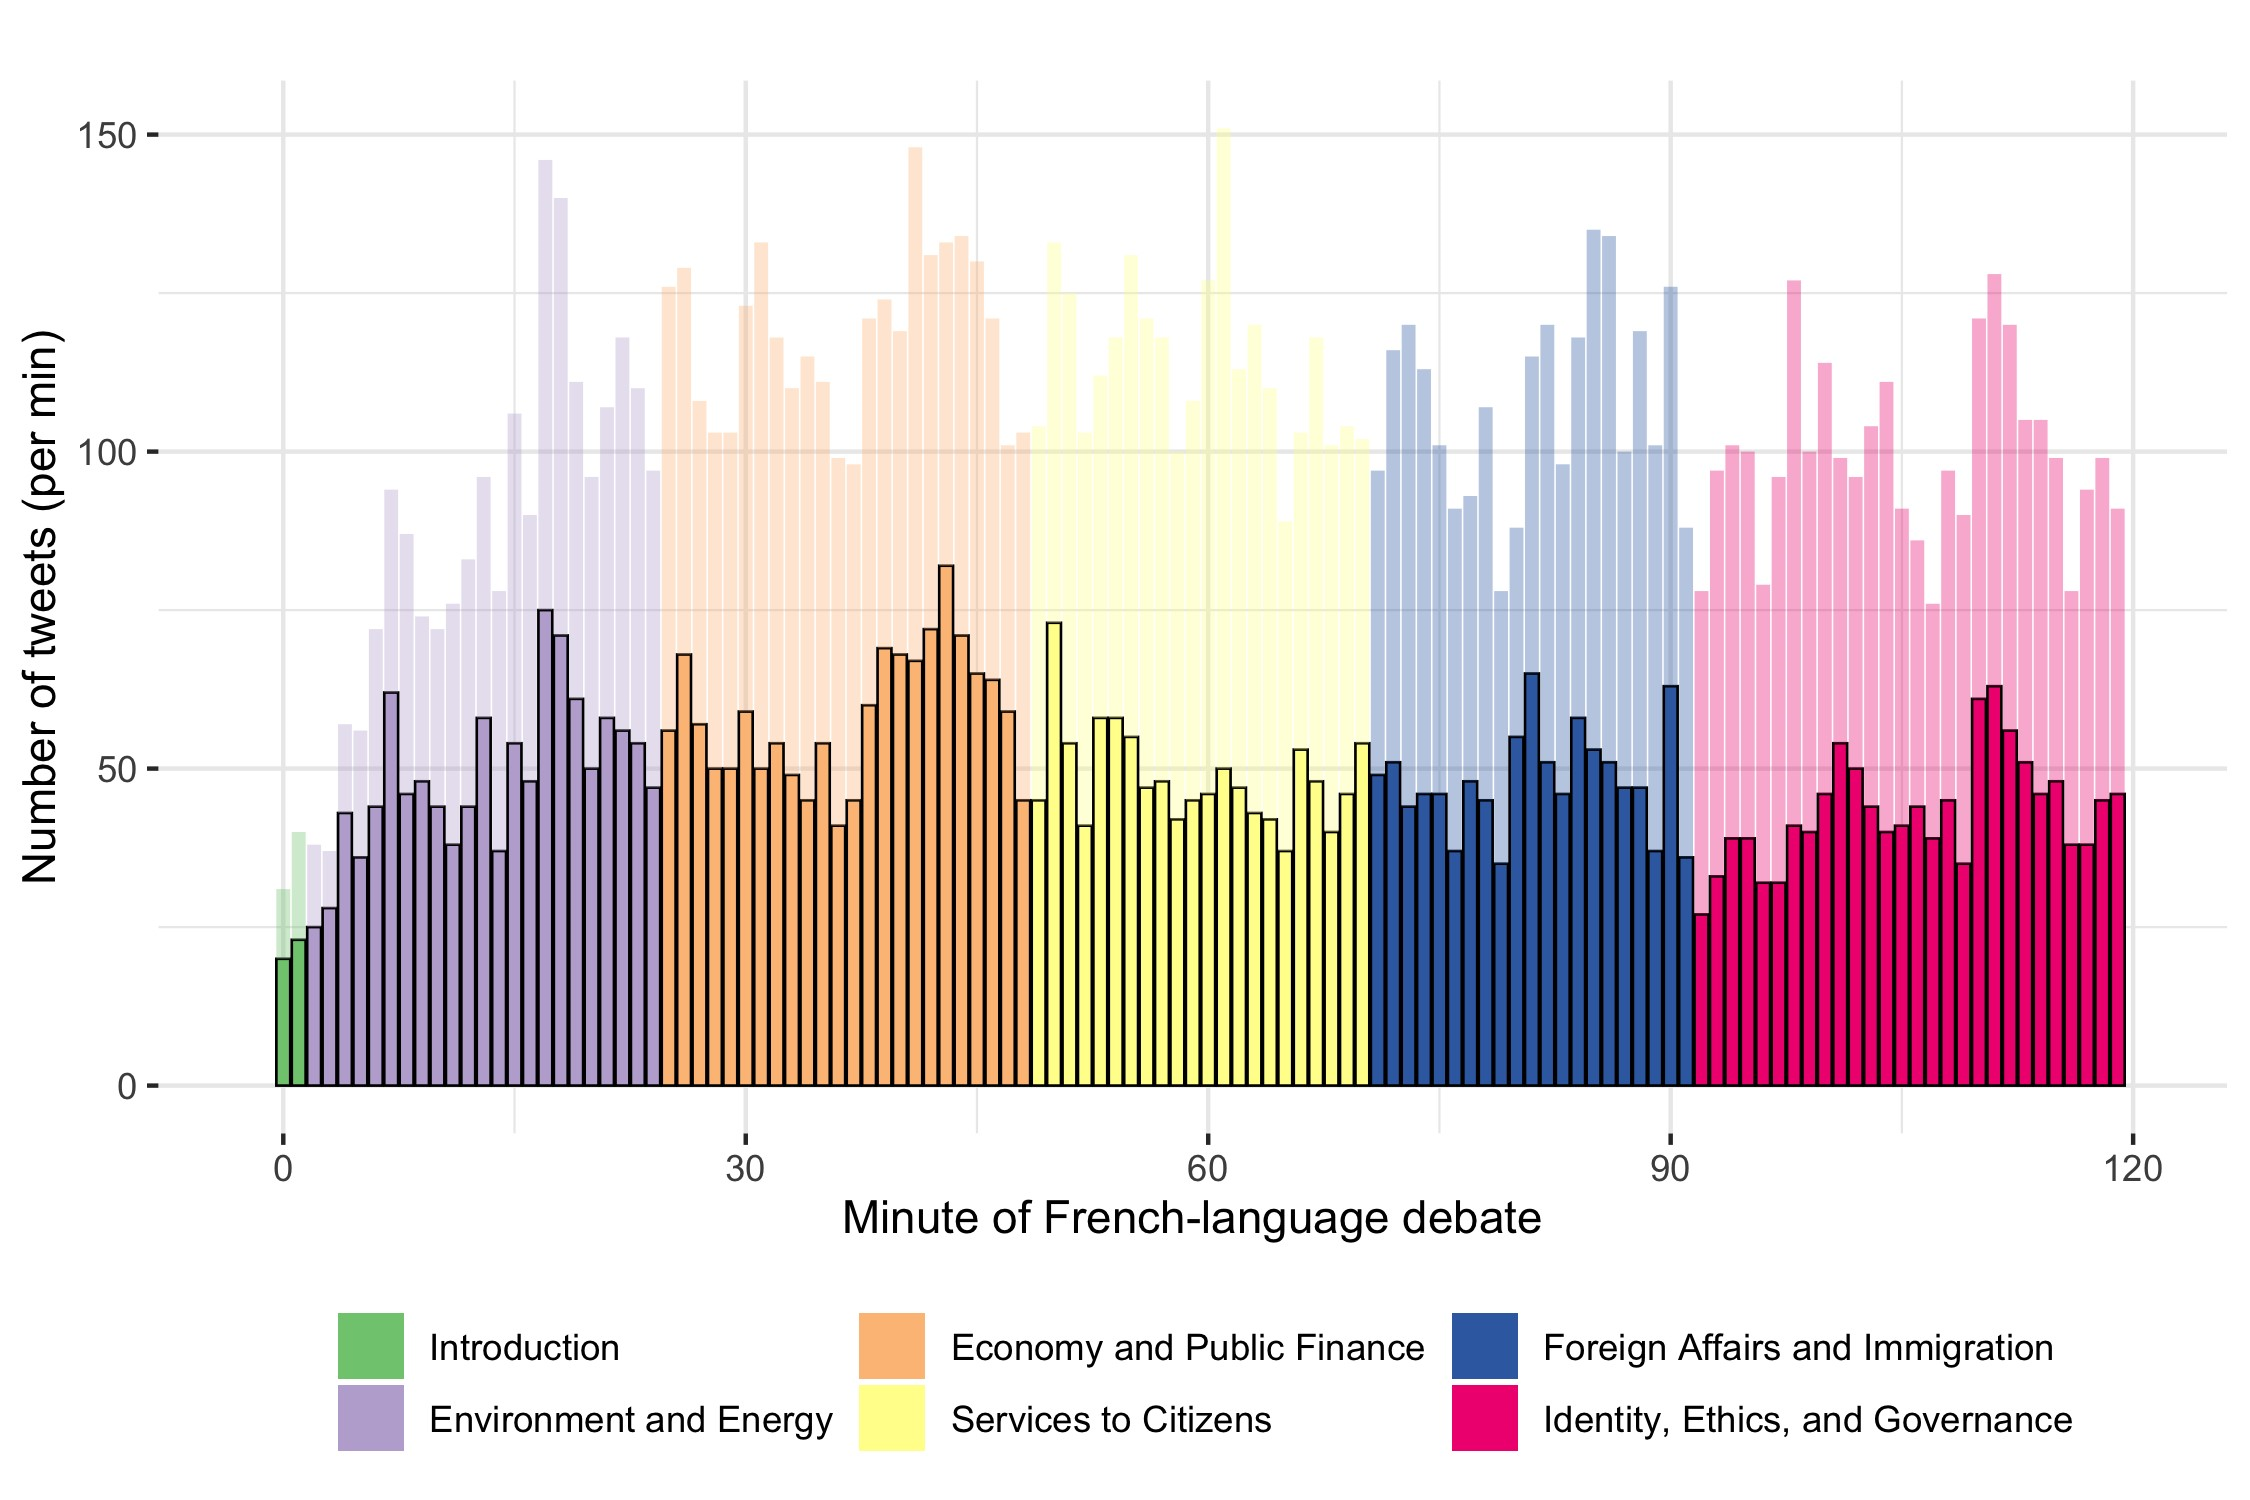
Figure 4: Debate-related Twitter activity during French-language debate
5.2. Debate Awareness and Viewership Across Demographic Groups
We were asked by the Commission to assess outreach toward Canadians with disabilities, Indigenous groups, remote communities, linguistic minorities, and ethno-Canadian communities.
To assess the demographic distribution of debate awareness, we modeled awareness as a function of disability identity, ethnicity, rural/urban residence, official language minority status, and age (Table 6). The results show that: (1) respondents who identified as disabled were 10 percentage points less likely to be aware of the upcoming debates than respondents who did not identify as disabled; (2) respondents of non-European ancestry were 6 percentage points less likely to be aware of the debates than respondents of European ancestry; (3) respondents living in rural ridings were 9 percentage points less likely to be aware of the debates than respondents living in urban ridings; and (4) older Canadians were more likely to be aware of the debates (awareness increased by approximately three-quarters of a percentage point for each additional year of age). We did not find evidence of differences in debate awareness between Indigenous respondents and respondents of European ancestry, or between official language minorities and other Canadians.
To assess the demographic distribution of debate viewership, we modeled debate viewership (defined as having watched the English debate, the French debate, or both) as a function of the same set of demographic factors (Table 7). Unlike debate awareness, however, we find no clear evidence that debate viewership varied with respect to disability, ethnicity, or rural/urban residence. We do, however, find that: (1) official language minorities were 10 percentage points more likely to watch a debate; and (2) older Canadians were also more likely to watch (viewership increased by approximately four-tenths of a percentage point for each additional year of age).
|
Disability |
-0.0994***(0.0268) |
|---|---|
|
Non-European |
-0.0572* (0.0274) |
|
Indigenous |
-0.0136 (0.0469) |
|
Rural |
-0.0912*** (0.0237) |
|
Official language minority |
0.0285 (.0283) |
|
Age |
0.00732*** (0.000577) |
|
Constant |
0.0594 (0.0320) |
|
Observations |
2939 |
Standard errors in parentheses. Survey responses are weighted (see Methods for details.)
The dependent variable is binary. Disability is measured by respondent self-identification; the reference category is no disability. Ethnicity is categorized as European, Non-European, or Indigenous ancestry; the reference category is European ancestry. Rural is identified as respondents who live in a federal riding that is in the bottom quartile by population density; the reference category is urban. Official language minority is identified as either a French mother-tongue respondent living outside Quebec or an English mother-tongue respondent living in Quebec; the reference category is not an official language minority. Age is treated as continuous. *p < 0.05, **p < 0.01, ***p < 0.001.
|
Disability |
-0.000797 (0.0345) |
|---|---|
|
Non-European |
-0.0142 (0.0362) |
|
Indigenous |
0.00610 (0.0685) |
|
Rural |
-0.0451 (0.0324) |
|
Official language minority |
0.0905* (0.0378) |
|
Age |
0.00381*** (0.000786) |
|
Constant |
0.221***(0.0447) |
|
Observations |
2162 |
Standard errors in parentheses. Survey responses are weighted (see Methods for details.)
The dependent variable is binary. Disability is measured by respondent self-identification; the reference category is no disability. Ethnicity is categorized as European, Non-European, or Indigenous ancestry; the reference category is European ancestry. Rural is identified as respondents who live in a federal riding that is in the bottom quartile by population density; the reference category is urban. Official language minority is identified as either a French mother-tongue respondent living outside Quebec or an English mother-tongue respondent living in Quebec; the reference category is not an official language minority. Age is treated as continuous. *p < 0.05, **p < 0.01, ***p < 0.001.
5.3. Viewership medium
We asked respondents who reported watching the debates what medium they used: TV, radio, or online. Table 8 reports the distribution for those who watched the English debate; Table 9 reports the same for those who watched the French debate. For both the English and French debates, respondents overwhelming reported watching the debate on television.
|
|
Percent |
N |
|---|---|---|
|
TV |
85.35 |
827 |
|
Radio |
5.06 |
49 |
|
Online |
9.60 |
93 |
|
Total |
100.00 |
969 |
Question administered to debate watchers only. Survey responses are unweighted.
|
|
Percent |
N |
|---|---|---|
|
TV |
93.17 |
232 |
|
Radio |
1.61 |
4 |
|
Online |
5.22 |
13 |
|
Total |
100.00 |
249 |
Question administered to debate watchers only. Survey responses are unweighted.
5.4. Viewed with others
We asked respondents who reported watching the debates whether they did so in the company of others. Majorities of both those who watched the English-language debate (Table 10) and those who watched the French-language debate (Table 11) report doing so alone.
We then followed up by asking respondents who reported watching with others whether they did so as part of an organized event. This was the case for approximately 1 in 10 respondents who watched with others (Tables 12 and 13).
|
|
Percent |
N |
|---|---|---|
|
Alone |
58.10 |
563 |
|
With Others |
41.90 |
406 |
|
Total |
100.00 |
969 |
Question administered to debate watchers only. Survey responses are unweighted.
|
|
Percent |
N |
|---|---|---|
|
Alone |
63.05 |
157 |
|
With Others |
36.95 |
92 |
|
Total |
100.00 |
249 |
Question administered to debate watchers only. Survey responses are unweighted.
|
|
Percent |
N |
|---|---|---|
|
Not part of organized event |
89.16 |
362 |
|
Part of organized event |
10.84 |
44 |
|
Total |
100.00 |
406 |
Question administered to respondents who watched with others. Survey responses are unweighted.
|
|
Percent |
N |
|---|---|---|
|
Not part of organized event |
86.96 |
80 |
|
Part of organized event |
13.04 |
12 |
|
Total |
100.00 |
92 |
Question administered to respondents who watched with others. Survey responses are unweighted.
5.5. Discussed debates with others, including on social media
Significant proportions of debate watchers report discussing the debates with others: approximately 60% of those who watched the English-language debate reported discussing the debate (Table 14); approximately 50% of those who reported watching the French-language debate reported doing the same (Table 15).
|
|
Percent |
N |
|---|---|---|
|
Yes |
58.72 |
569 |
|
No |
41.28 |
400 |
|
Total |
100.00 |
969 |
Question administered to debate watchers only. Survey responses are unweighted.
|
|
Percent |
N |
|---|---|---|
|
Yes |
48.59 |
121 |
|
No |
51.41 |
128 |
|
Total |
100.00 |
249 |
Question administered to debate watchers only. Survey responses are unweighted.
The rate of reported discussion online, however, was more modest. Among those who watched the English-language debate, 12% commented on social media about the debate (Table 16). Among those who watched the French-language debate, 8% commented on social media (Table 17).
|
|
Percent |
N |
|---|---|---|
|
Yes |
12.38 |
120 |
|
No |
87.62 |
849 |
|
Total |
100.00 |
969 |
Question administered to debate watchers only. Survey responses are unweighted.
|
|
Percent |
N |
|---|---|---|
|
Yes |
8.43 |
21 |
|
No |
91.57 |
228 |
|
Total |
100.00 |
249 |
Question administered to debate watchers only. Survey responses are unweighted.
5.6. Reasons for not watching the debates
We asked respondents in Wave 2 who reported not watching the debate what their "main reason" for not watching was. The results for the English and French debates are reported in Tables 18 and 19, respectively. For both debates, the most common reason given was "I was too busy." Other common responses were "I already know how I'm going to vote," "I don't think debates are useful," and "I'm not interested in politics." In short, the typical reasons for not watching refer to either the respondent's prior time commitments or a lack of interest in election debates. By contrast, only a minority of reasons pertain to a lack of awareness about the debate or a lack of access to the debate.Endnote [2]
|
|
Percent |
N |
|---|---|---|
|
Did not know about debate |
6.75 |
98 |
|
Did not know where to watch |
2.96 |
43 |
|
Was not able to access |
8.61 |
125 |
|
Too busy |
25.36 |
368 |
|
Already know how will vote |
18.47 |
268 |
|
Debates are not useful |
14.82 |
215 |
|
Not interested in politics |
13.44 |
195 |
|
Other |
9.58 |
139 |
|
Total |
100.00 |
1451 |
Question administered to respondents who did not watch the debate. Survey responses are unweighted.
|
|
Percent |
N |
|---|---|---|
|
Did not know about debate |
4.97 |
18 |
|
Did not know where to watch |
1.38 |
5 |
|
Was not able to access |
9.94 |
36 |
|
Too busy |
23.76 |
86 |
|
Already know how will vote |
20.44 |
74 |
|
Debates are not useful |
12.98 |
47 |
|
Not interested in politics |
13.81 |
50 |
|
Other |
12.71 |
46 |
|
Total |
100.00 |
362 |
Question administered to respondents who did not watch the debate. Survey responses are unweighted.
5.7. Overall level of interest on Twitter
The overall level of interest in the debates on Twitter was very high. As shown in Figure 5, the highest amount of Canadian politics English language Twitter activity was in the day immediately following the English-language debate. The French-language debate seemed to also spark some conversation, but the last days of the campaign generally saw higher activity.
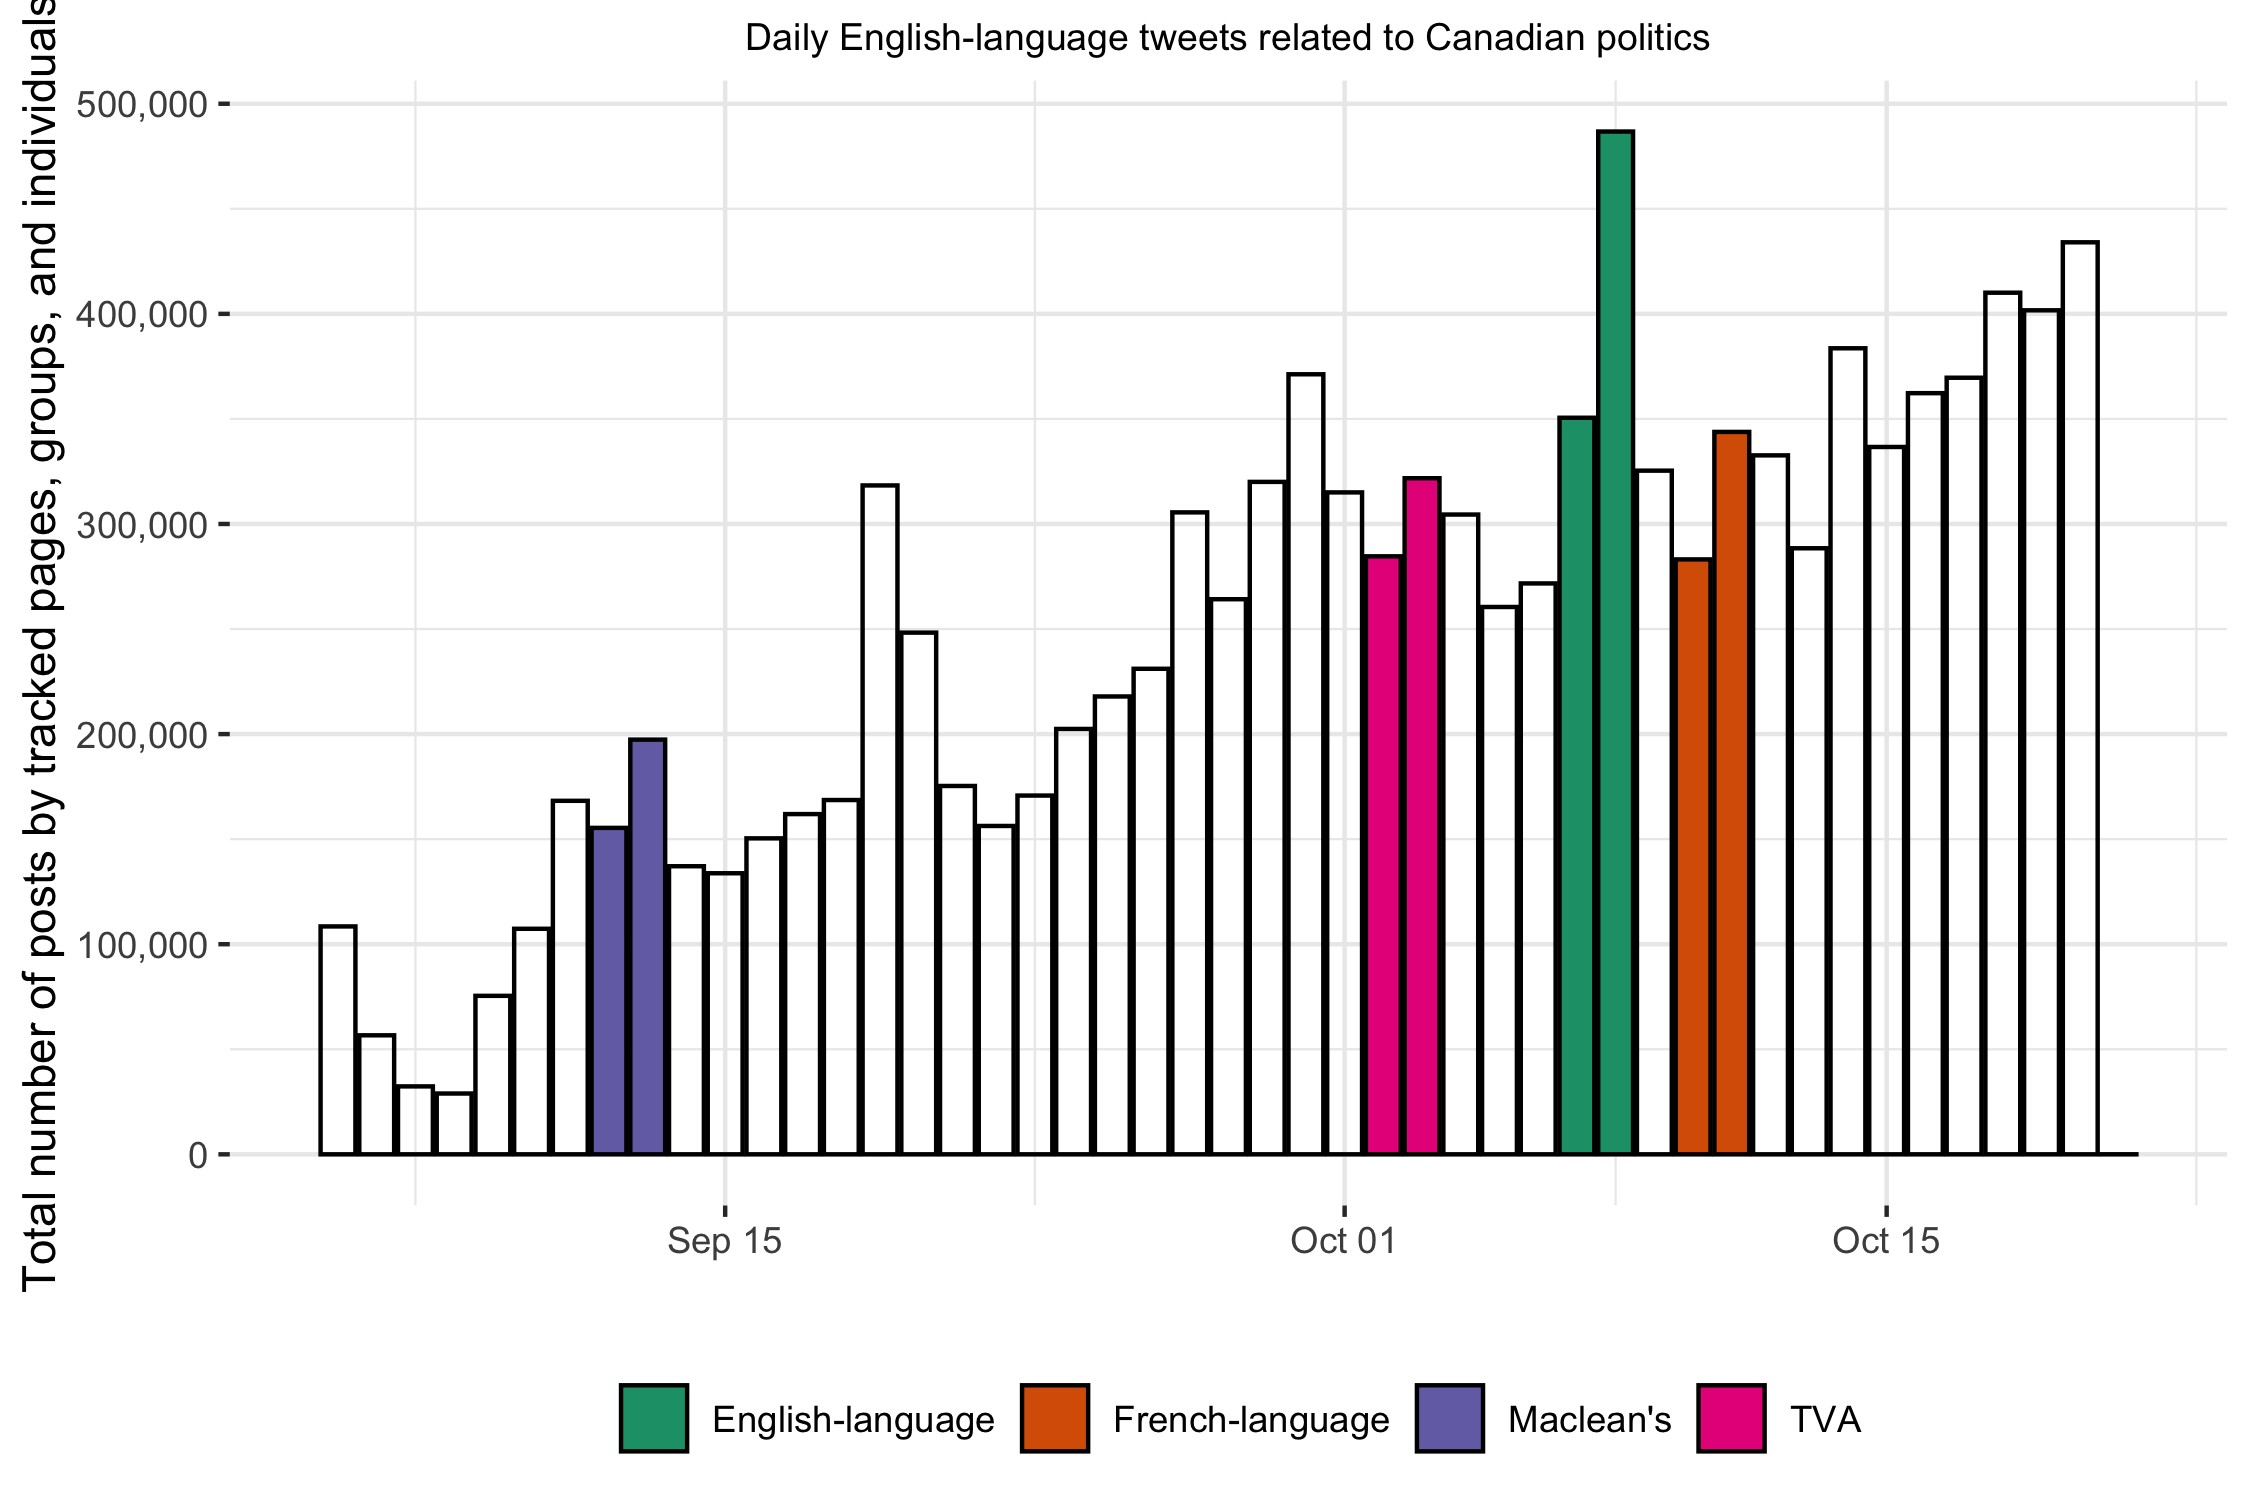
Figure 5: Debate-related Twitter activity during English-language debate
The level of French-language conversation was also very high after the French-language debate amongst French-language social media users as shown in Figure 6, although the level of conversation after the TVA Face-à-Face debate slightly edged out that of the Leaders' Debates Commission one.
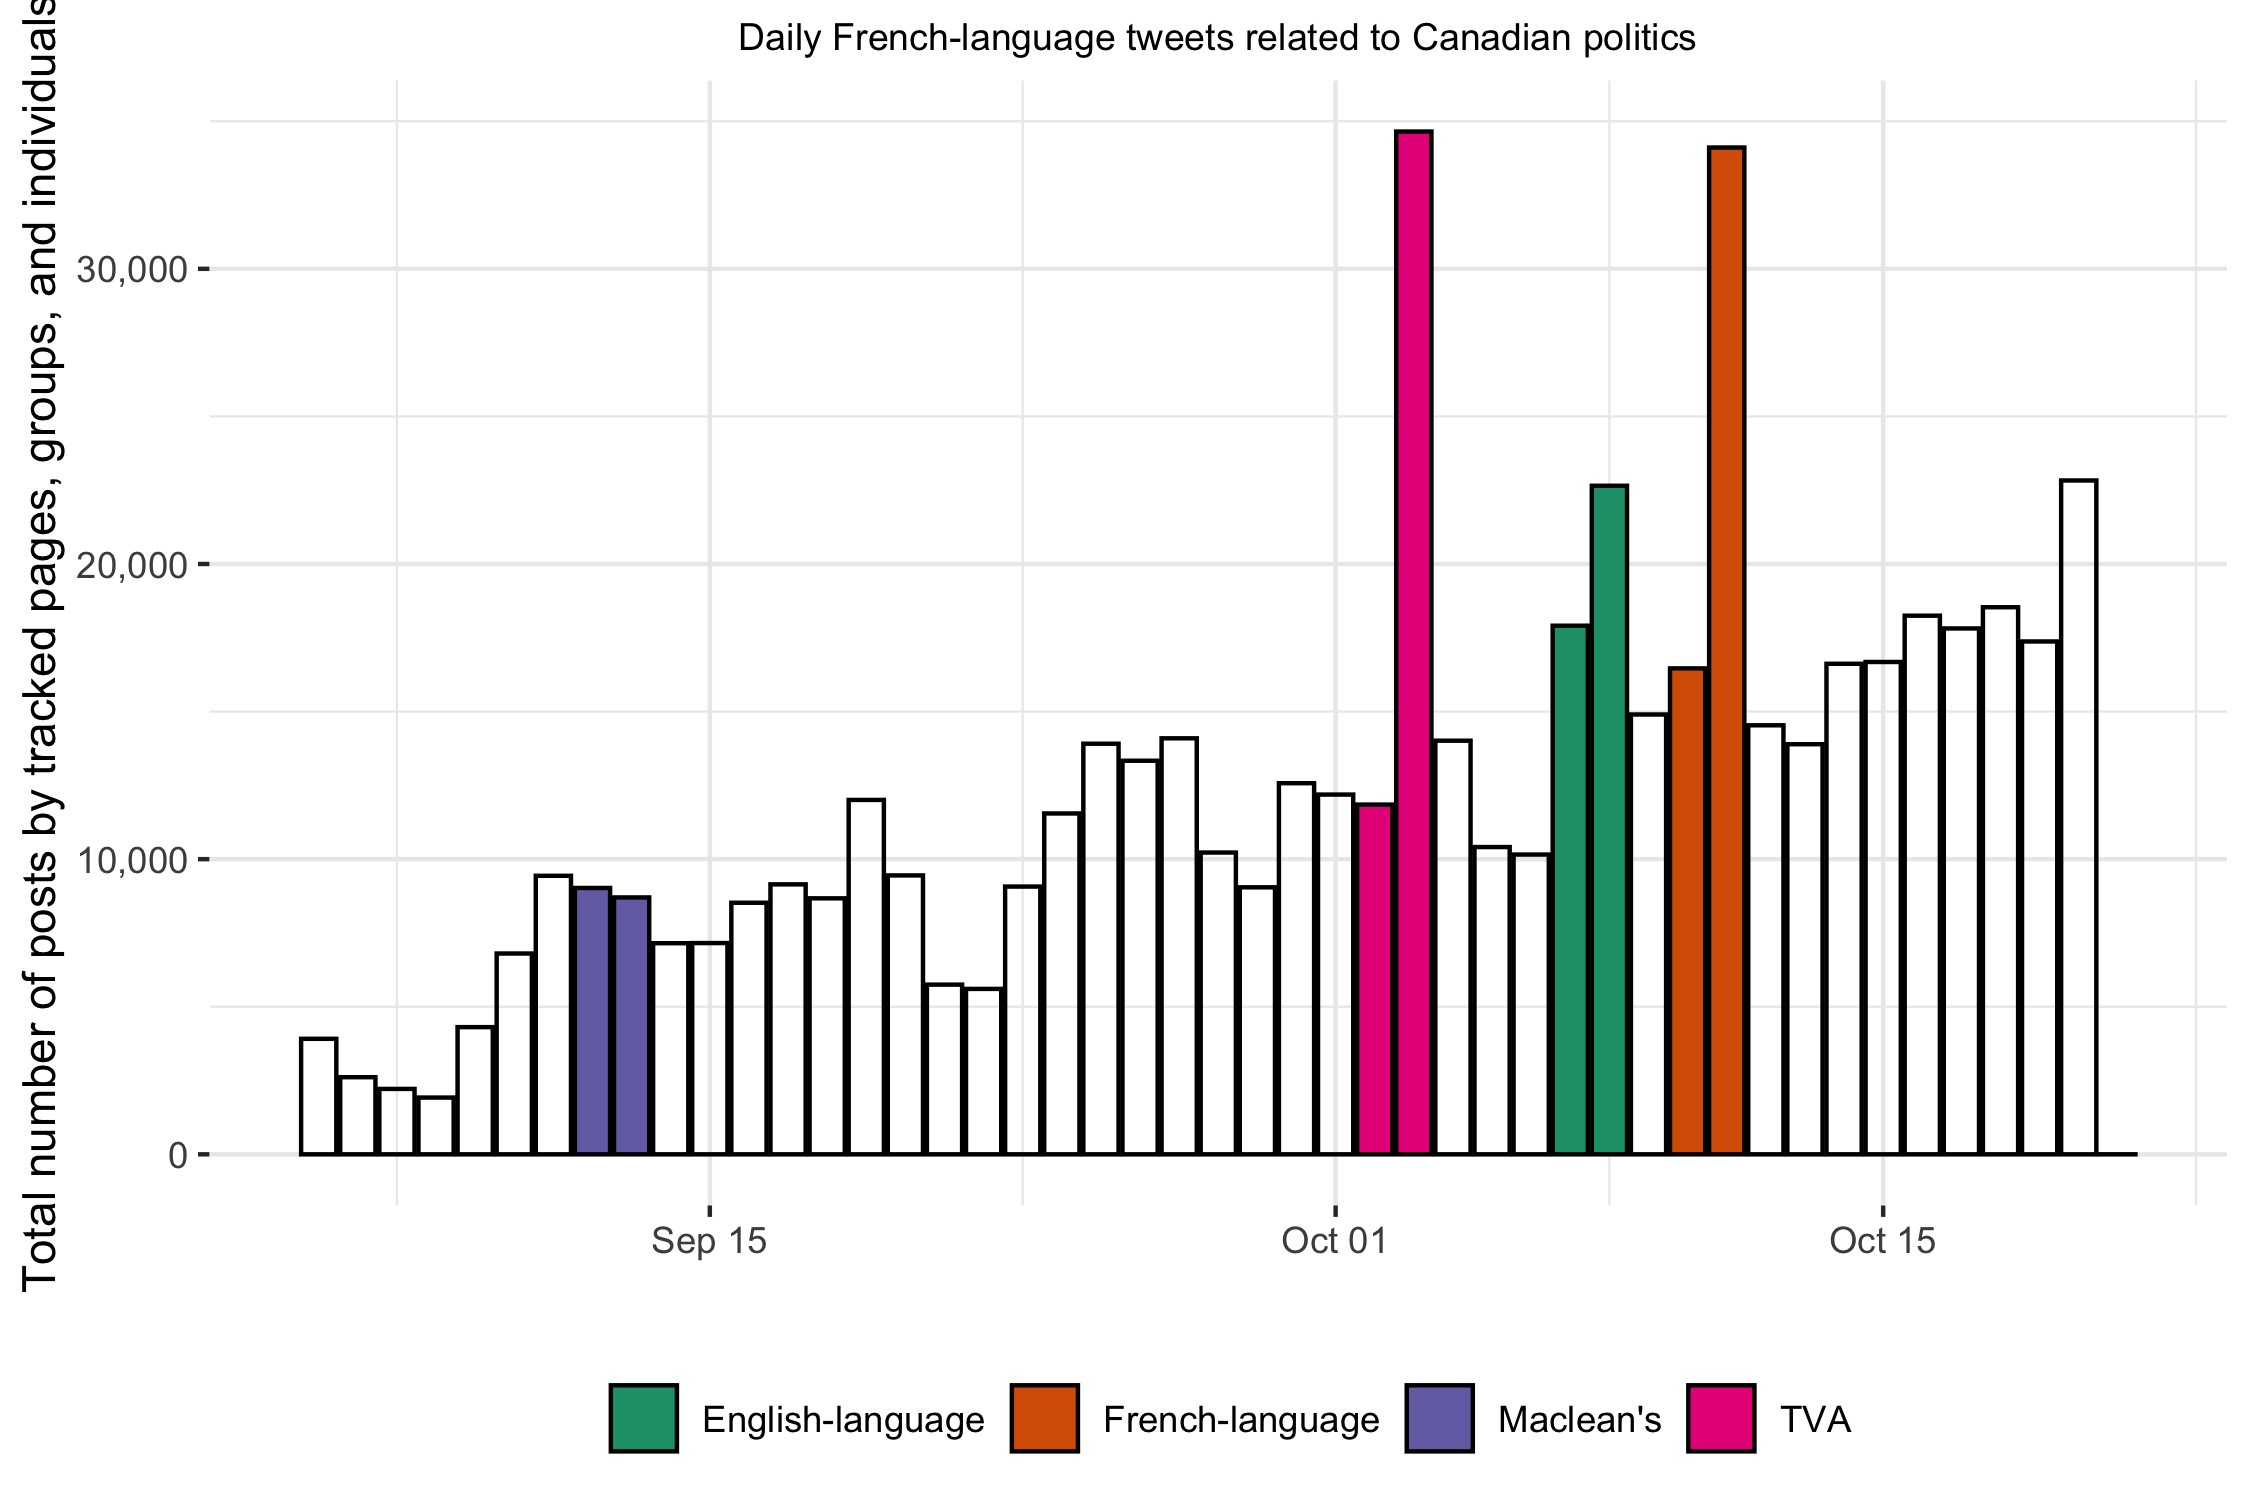
Figure 6: Debate-related Twitter activity during French-language debate
6. Debate evaluation
6.1. Survey respondents
In Wave 2 of the survey, we presented debate watchers with a series of questions aimed gauging their attitudes about the debate. More specifically, we presented respondents with a battery of 18 statements about each debate. By design, some statements were framed in a positive light and others were framed in a negative light. Respondents were then asked whether they strongly disagree, somewhat disagreed, somewhat agreed, or strongly agreed with each statement.
The 18 statements can be grouped into three main dimensions: evaluations of the debate content and format; evaluations of the debate moderators; and evaluations of the party leaders.
6.1.1. Evaluation of debate content and format
Respondents offered a mixed set of evaluations of the debate content and format. On the one hand, majorities of both those who watched the English-language debate and those who watched the French-language debate agreed: that the debate was informative (Tables 20 and 21); that the debate helped them to better understand the issues (Tables 26 and 27); and that the debate helped them to better understand the difference between the parties (Tables 28 and 29). At the same time, 52% of those who watched the English-language debate agreed that the debate was dull (Table 22); 45% of those of watched the French-language debate said the same (Table 23). In addition, majorities of both those who watched the English-language debate and those who watched the French-language debate agreed: that the debate was repetitive (Tables 24 and 25) and that the debate didn't cover the issues that were most important to them (Tables 30 and 31).
We also note that 63% of those who watched the English debate either somewhat or strongly agreed with the statement that "There were too many leaders participating in the debate." (Table 32). Only 41% of those who watched the French-language debate agreed that there were too many leaders on the stage (Table 33).
|
|
Percent |
N |
|---|---|---|
|
Strongly disagree |
10.11 |
98 |
|
Somewhat disagree |
30.55 |
296 |
|
Somewhat agree |
45.61 |
442 |
|
Strongly agree |
11.66 |
113 |
|
DK |
2.06 |
20 |
|
Total |
100.00 |
969 |
Question administered to debate watchers only. Survey responses are unweighted.
|
|
Percent |
N |
|---|---|---|
|
Strongly disagree |
3.21 |
8 |
|
Somewhat disagree |
20.48 |
51 |
|
Somewhat agree |
59.84 |
149 |
|
Strongly agree |
12.45 |
31 |
|
DK |
4.02 |
10 |
|
Total |
100.00 |
249 |
Question administered to debate watchers only. Survey responses are unweighted.
|
|
Percent |
N |
|---|---|---|
|
Strongly disagree |
8.05 |
78 |
|
Somewhat disagree |
37.56 |
364 |
|
Somewhat agree |
35.50 |
344 |
|
Strongly agree |
16.00 |
155 |
|
DK |
2.89 |
28 |
|
Total |
100.00 |
969 |
Question administered to debate watchers only. Survey responses are unweighted.
|
|
Percent |
N |
|---|---|---|
|
Strongly disagree |
9.64 |
24 |
|
Somewhat disagree |
43.78 |
109 |
|
Somewhat agree |
32.93 |
82 |
|
Strongly agree |
11.65 |
29 |
|
DK |
2.01 |
5 |
|
Total |
100.00 |
249 |
Question administered to debate watchers only. Survey responses are unweighted.
|
|
Percent |
N |
|---|---|---|
|
Strongly disagree |
2.37 |
23 |
|
Somewhat disagree |
17.75 |
172 |
|
Somewhat agree |
53.77 |
521 |
|
Strongly agree |
22.50 |
218 |
|
DK |
3.61 |
35 |
|
Total |
100.00 |
969 |
Question administered to debate watchers only. Survey responses are unweighted.
|
|
Percent |
N |
|---|---|---|
|
Strongly disagree |
2.81 |
7 |
|
Somewhat disagree |
32.53 |
81 |
|
Somewhat agree |
46.99 |
117 |
|
Strongly agree |
16.06 |
40 |
|
DK |
1.61 |
4 |
|
Total |
100.00 |
249 |
Question administered to debate watchers only. Survey responses are unweighted.
|
|
Percent |
N |
|---|---|---|
|
Strongly disagree |
12.59 |
122 |
|
Somewhat disagree |
34.88 |
338 |
|
Somewhat agree |
39.73 |
385 |
|
Strongly agree |
10.73 |
104 |
|
DK |
2.06 |
20 |
|
Total |
100.00 |
969 |
Question administered to debate watchers only. Survey responses are unweighted.
|
|
Percent |
N |
|---|---|---|
|
Strongly disagree |
3.21 |
8 |
|
Somewhat disagree |
21.69 |
54 |
|
Somewhat agree |
57.03 |
142 |
|
Strongly agree |
13.25 |
33 |
|
DK |
4.82 |
12 |
|
Total |
100.00 |
249 |
Question administered to debate watchers only. Survey responses are unweighted.
|
|
Percent |
N |
|---|---|---|
|
Strongly disagree |
9.18 |
89 |
|
Somewhat disagree |
24.66 |
239 |
|
Somewhat agree |
47.78 |
463 |
|
Strongly agree |
15.89 |
154 |
|
DK |
2.48 |
24 |
|
Total |
100.00 |
969 |
Question administered to debate watchers only. Survey responses are unweighted.
|
|
Percent |
N |
|---|---|---|
|
Strongly disagree |
2.81 |
7 |
|
Somewhat disagree |
18.88 |
47 |
|
Somewhat agree |
57.83 |
144 |
|
Strongly agree |
16.47 |
41 |
|
DK |
4.02 |
10 |
|
Total |
100.00 |
249 |
Question administered to debate watchers only. Survey responses are unweighted.
|
|
Percent |
N |
|---|---|---|
|
Strongly disagree |
3.61 |
35 |
|
Somewhat disagree |
29.51 |
286 |
|
Somewhat agree |
42.72 |
414 |
|
Strongly agree |
20.85 |
202 |
|
DK |
3.30 |
32 |
|
Total |
100.00 |
969 |
Question administered to debate watchers only. Survey responses are unweighted.
|
|
Percent |
N |
|---|---|---|
|
Strongly disagree |
6.43 |
16 |
|
Somewhat disagree |
36.95 |
92 |
|
Somewhat agree |
41.37 |
103 |
|
Strongly agree |
12.05 |
30 |
|
DK |
3.21 |
8 |
|
Total |
100.00 |
249 |
Question administered to debate watchers only. Survey responses are unweighted.
|
|
Percent |
N |
|---|---|---|
|
Strongly disagree |
11.15 |
108 |
|
Somewhat disagree |
22.39 |
217 |
|
Somewhat agree |
31.79 |
308 |
|
Strongly agree |
31.37 |
304 |
|
DK |
3.30 |
32 |
|
Total |
100.00 |
969 |
Question administered to debate watchers only. Survey responses are unweighted.
|
|
Percent |
N |
|---|---|---|
|
Strongly disagree |
14.86 |
37 |
|
Somewhat disagree |
38.96 |
97 |
|
Somewhat agree |
26.10 |
65 |
|
Strongly agree |
14.46 |
36 |
|
DK |
5.62 |
14 |
|
Total |
100.00 |
249 |
Question administered to debate watchers only. Survey responses are unweighted.
6.1.2. Evaluations of the debate moderators
Respondents' evaluations of the debate moderators reflected an appreciation for their conduct, but also a desire for them to take a more assertive stance with respect to the party leaders. Very large majorities of both those who watched the English-language debate and those who watched the French-language debate agreed that the moderators treated each leader fairly (Tables 34 and 35) and that the moderators asked good questions (Tables 36 and 37). Majorities of debate watchers also said that the moderators provided enough time to the leaders to answer questions (Tables 38 and 39). Debate watchers were divided over the question of whether the moderators should have provided more time for the leaders to debate each other directly (Tables 40 and 41).
At the same time, respondents indicated that they would have liked to see moderators doing more to push the party leaders. Over 80% of those who watched the English-language debate agreed that the moderators "should have done more to push leaders who avoided answering the question" (Table 42); 72% of those who watched the French-language debate agreed with the same statement (Table 43). In addition, more than three-quarters of those who watched the English-language debate and those who watched the French-language debate agreed that the moderators "should have done more to push leaders who gave factually inaccurate answers" (Tables 44 and 45).
|
|
Percent |
N |
|---|---|---|
|
Strongly disagree |
5.37 |
52 |
|
Somewhat disagree |
11.15 |
108 |
|
Somewhat agree |
47.68 |
462 |
|
Strongly agree |
31.27 |
303 |
|
DK |
4.54 |
44 |
|
Total |
100.00 |
969 |
Question administered to debate watchers only. Survey responses are unweighted.
|
|
Percent |
N |
|---|---|---|
|
Strongly disagree |
2.41 |
6 |
|
Somewhat disagree |
8.84 |
22 |
|
Somewhat agree |
57.83 |
144 |
|
Strongly agree |
27.31 |
68 |
|
DK |
3.61 |
9 |
|
Total |
100.00 |
249 |
Question administered to debate watchers only. Survey responses are unweighted.
|
|
Percent |
N |
|---|---|---|
|
Strongly disagree |
4.23 |
41 |
|
Somewhat disagree |
15.79 |
153 |
|
Somewhat agree |
55.42 |
537 |
|
Strongly agree |
21.26 |
206 |
|
DK |
3.30 |
32 |
|
Total |
100.00 |
969 |
Question administered to debate watchers only. Survey responses are unweighted.
|
|
Percent |
N |
|---|---|---|
|
Strongly disagree |
2.01 |
5 |
|
Somewhat disagree |
8.84 |
22 |
|
Somewhat agree |
59.84 |
149 |
|
Strongly agree |
25.70 |
64 |
|
DK |
3.61 |
9 |
|
Total |
100.00 |
249 |
Question administered to debate watchers only. Survey responses are unweighted.
|
|
Percent |
N |
|---|---|---|
|
Strongly disagree |
12.07 |
117 |
|
Somewhat disagree |
29.93 |
290 |
|
Somewhat agree |
41.38 |
401 |
|
Strongly agree |
13.52 |
131 |
|
DK |
3.10 |
30 |
|
Total |
100.00 |
969 |
Question administered to debate watchers only. Survey responses are unweighted.
|
|
Percent |
N |
|---|---|---|
|
Strongly disagree |
2.41 |
6 |
|
Somewhat disagree |
22.49 |
56 |
|
Somewhat agree |
55.02 |
137 |
|
Strongly agree |
17.27 |
43 |
|
DK |
2.81 |
7 |
|
Total |
100.00 |
249 |
Question administered to debate watchers only. Survey responses are unweighted.
|
|
Percent |
N |
|---|---|---|
|
Strongly disagree |
5.06 |
49 |
|
Somewhat disagree |
29.62 |
287 |
|
Somewhat agree |
37.46 |
363 |
|
Strongly agree |
22.91 |
222 |
|
DK |
4.95 |
48 |
|
Total |
100.00 |
969 |
Question administered to debate watchers only. Survey responses are unweighted.
|
|
Percent |
N |
|---|---|---|
|
Strongly disagree |
6.43 |
16 |
|
Somewhat disagree |
41.37 |
103 |
|
Somewhat agree |
36.55 |
91 |
|
Strongly agree |
9.24 |
23 |
|
DK |
6.43 |
16 |
|
Total |
100.00 |
249 |
Question administered to debate watchers only. Survey responses are unweighted.
|
|
Percent |
N |
|---|---|---|
|
Strongly disagree |
1.75 |
17 |
|
Somewhat disagree |
9.70 |
94 |
|
Somewhat agree |
38.91 |
377 |
|
Strongly agree |
45.41 |
440 |
|
DK |
4.23 |
41 |
|
Total |
100.00 |
969 |
Question administered to debate watchers only. Survey responses are unweighted.
|
|
Percent |
N |
|---|---|---|
|
Strongly disagree |
2.41 |
6 |
|
Somewhat disagree |
17.67 |
44 |
|
Somewhat agree |
44.18 |
110 |
|
Strongly agree |
28.11 |
70 |
|
DK |
7.63 |
19 |
|
Total |
100.00 |
249 |
Question administered to debate watchers only. Survey responses are unweighted.
|
|
Percent |
N |
|---|---|---|
|
Strongly disagree |
2.48 |
24 |
|
Somewhat disagree |
11.15 |
108 |
|
Somewhat agree |
37.25 |
361 |
|
Strongly agree |
42.31 |
410 |
|
DK |
6.81 |
66 |
|
Total |
100.00 |
969 |
Question administered to debate watchers only. Survey responses are unweighted.
|
|
Percent |
N |
|---|---|---|
|
Strongly disagree |
1.20 |
3 |
|
Somewhat disagree |
15.66 |
39 |
|
Somewhat agree |
51.81 |
129 |
|
Strongly agree |
23.29 |
58 |
|
DK |
8.03 |
20 |
|
Total |
100.00 |
249 |
Question administered to debate watchers only. Survey responses are unweighted.
6.1.3. Evaluations of the party leaders
Debate watchers typically reported negative evaluations of the party leaders' conduct during the debates. Less than half of those who watched the English-language debate and those who watched the French-language debate agreed that the leaders gave clear answers (Tables 46 and 47). Approximately one-third of those who watched the English-language debate agreed that the leaders were respectful of each other; by contrast, just over 60% of those who watched the French debate agreed that the leaders were respectful (Tables 48 and 49).
In addition, large majorities of both those who watched the English-language debate and those who watched the French-language debate agreed that the leaders "interrupted each other too much" (Tables 50 and 51), gave answers that "felt scripted and rehearsed" (Tables 52 and 53), and "often avoided answering the question" (Tables 54 and 55).
|
|
Percent |
N |
|---|---|---|
|
Strongly disagree |
18.68 |
181 |
|
Somewhat disagree |
46.13 |
447 |
|
Somewhat agree |
25.70 |
249 |
|
Strongly agree |
6.91 |
67 |
|
DK |
2.58 |
25 |
|
Total |
100.00 |
969 |
Question administered to debate watchers only. Survey responses are unweighted.
|
|
Percent |
N |
|---|---|---|
|
Strongly disagree |
5.62 |
14 |
|
Somewhat disagree |
50.60 |
126 |
|
Somewhat agree |
30.92 |
77 |
|
Strongly agree |
10.04 |
25 |
|
DK |
2.81 |
7 |
|
Total |
100.00 |
249 |
Question administered to debate watchers only. Survey responses are unweighted.
|
|
Percent |
N |
|---|---|---|
|
Strongly disagree |
20.64 |
200 |
|
Somewhat disagree |
40.66 |
394 |
|
Somewhat agree |
28.28 |
274 |
|
Strongly agree |
7.84 |
76 |
|
DK |
2.58 |
25 |
|
Total |
100.00 |
969 |
Question administered to debate watchers only. Survey responses are unweighted.
|
|
Percent |
N |
|---|---|---|
|
Strongly disagree |
5.62 |
14 |
|
Somewhat disagree |
29.72 |
74 |
|
Somewhat agree |
49.80 |
124 |
|
Strongly agree |
10.84 |
27 |
|
DK |
4.02 |
10 |
|
Total |
100.00 |
249 |
Question administered to debate watchers only. Survey responses are unweighted.
|
|
Percent |
N |
|---|---|---|
|
Strongly disagree |
1.34 |
13 |
|
Somewhat disagree |
7.53 |
73 |
|
Somewhat agree |
31.58 |
306 |
|
Strongly agree |
57.59 |
558 |
|
DK |
1.96 |
19 |
|
Total |
100.00 |
969 |
Question administered to debate watchers only. Survey responses are unweighted.
|
|
Percent |
N |
|---|---|---|
|
Strongly disagree |
2.01 |
5 |
|
Somewhat disagree |
27.31 |
68 |
|
Somewhat agree |
45.38 |
113 |
|
Strongly agree |
21.69 |
54 |
|
DK |
3.61 |
9 |
|
Total |
100.00 |
249 |
Question administered to debate watchers only. Survey responses are unweighted.
|
|
Percent |
N |
|---|---|---|
|
Strongly disagree |
1.86 |
18 |
|
Somewhat disagree |
16.00 |
155 |
|
Somewhat agree |
51.39 |
498 |
|
Strongly agree |
27.86 |
270 |
|
DK |
2.89 |
28 |
|
Total |
100.00 |
969 |
Question administered to debate watchers only. Survey responses are unweighted.
|
|
Percent |
N |
|---|---|---|
|
Strongly disagree |
0.40 |
1 |
|
Somewhat disagree |
15.26 |
38 |
|
Somewhat agree |
55.42 |
138 |
|
Strongly agree |
24.50 |
61 |
|
DK |
4.42 |
11 |
|
Total |
100.00 |
249 |
Question administered to debate watchers only. Survey responses are unweighted.
|
|
Percent |
N |
|---|---|---|
|
Strongly disagree |
1.03 |
10 |
|
Somewhat disagree |
8.88 |
86 |
|
Somewhat agree |
46.85 |
454 |
|
Strongly agree |
40.97 |
397 |
|
DK |
2.27 |
22 |
|
Total |
100.00 |
969 |
Question administered to debate watchers only. Survey responses are unweighted.
|
|
Percent |
N |
|---|---|---|
|
Strongly disagree |
0.80 |
2 |
|
Somewhat disagree |
15.66 |
39 |
|
Somewhat agree |
58.63 |
146 |
|
Strongly agree |
20.88 |
52 |
|
DK |
4.02 |
10 |
|
Total |
100.00 |
249 |
Question administered to debate watchers only. Survey responses are unweighted.
6.2. Evaluation of which leader won the debate
We asked respondents–regardless of whether they reported watching the debates–which party leader they thought won. In the English debate, setting aside the Don't Know responses, Jagmeet Singh was the leader most frequently identified as the winner (Table 56). In the French debate, again putting the Don't Know responses to one side, Yves-François Blanchet was the most frequent choice as the winner (Table 57).
|
|
Percent |
Standard error |
N |
|---|---|---|---|
|
Trudeau |
11.35 |
0.74 |
276 |
|
Scheer |
13.30 |
0.77 |
343 |
|
Singh |
19.34 |
0.89 |
495 |
|
May |
2.49 |
0.35 |
63 |
|
Blanchet |
3.78 |
0.42 |
101 |
|
Bernier |
1.40 |
0.30 |
30 |
|
DK |
48.33 |
1.18 |
1094 |
|
Total |
100.00 |
0.00 |
2402 |
Survey responses are weighted (see Methods for details).
|
|
Percent |
N |
|---|---|---|
|
Trudeau |
12.27 |
75 |
|
Scheer |
5.89 |
36 |
|
Singh |
6.22 |
38 |
|
May |
2.29 |
14 |
|
Blanchet |
28.15 |
172 |
|
Bernier |
2.62 |
16 |
|
DK |
42.55 |
260 |
|
Total |
100.00 |
611 |
Question administered to respondents who completed the survey after the start of French debate. Survey responses are unweighted.
6.3. Twitter
Overall there was a generally positive conversation on the debates as measured by sentiment of tweets appearing with debate-related hashtags. Figure 7 shows debate-related hashtag sentiment as compared to popular pro-Liberal and -Conservative hashtags as well as popular anti-Trudeau and anti-Scheer hashtags. The sentiment dictionary employed here adequately identifies positive and negative hashtags, with anti-Trudeau and anti-Scheer hashtags having overall negative sentiment and pro-Liberal and pro-Conservative ones having overall positive sentiment.
We find that debate-related hashtags generally had a positive tone and were overall more positive than major neutral Canadian politics ones. This reflects a degree of rallying where partisans use these debate hashtags to support their own party, however, also generally reflect on reception on the debates.
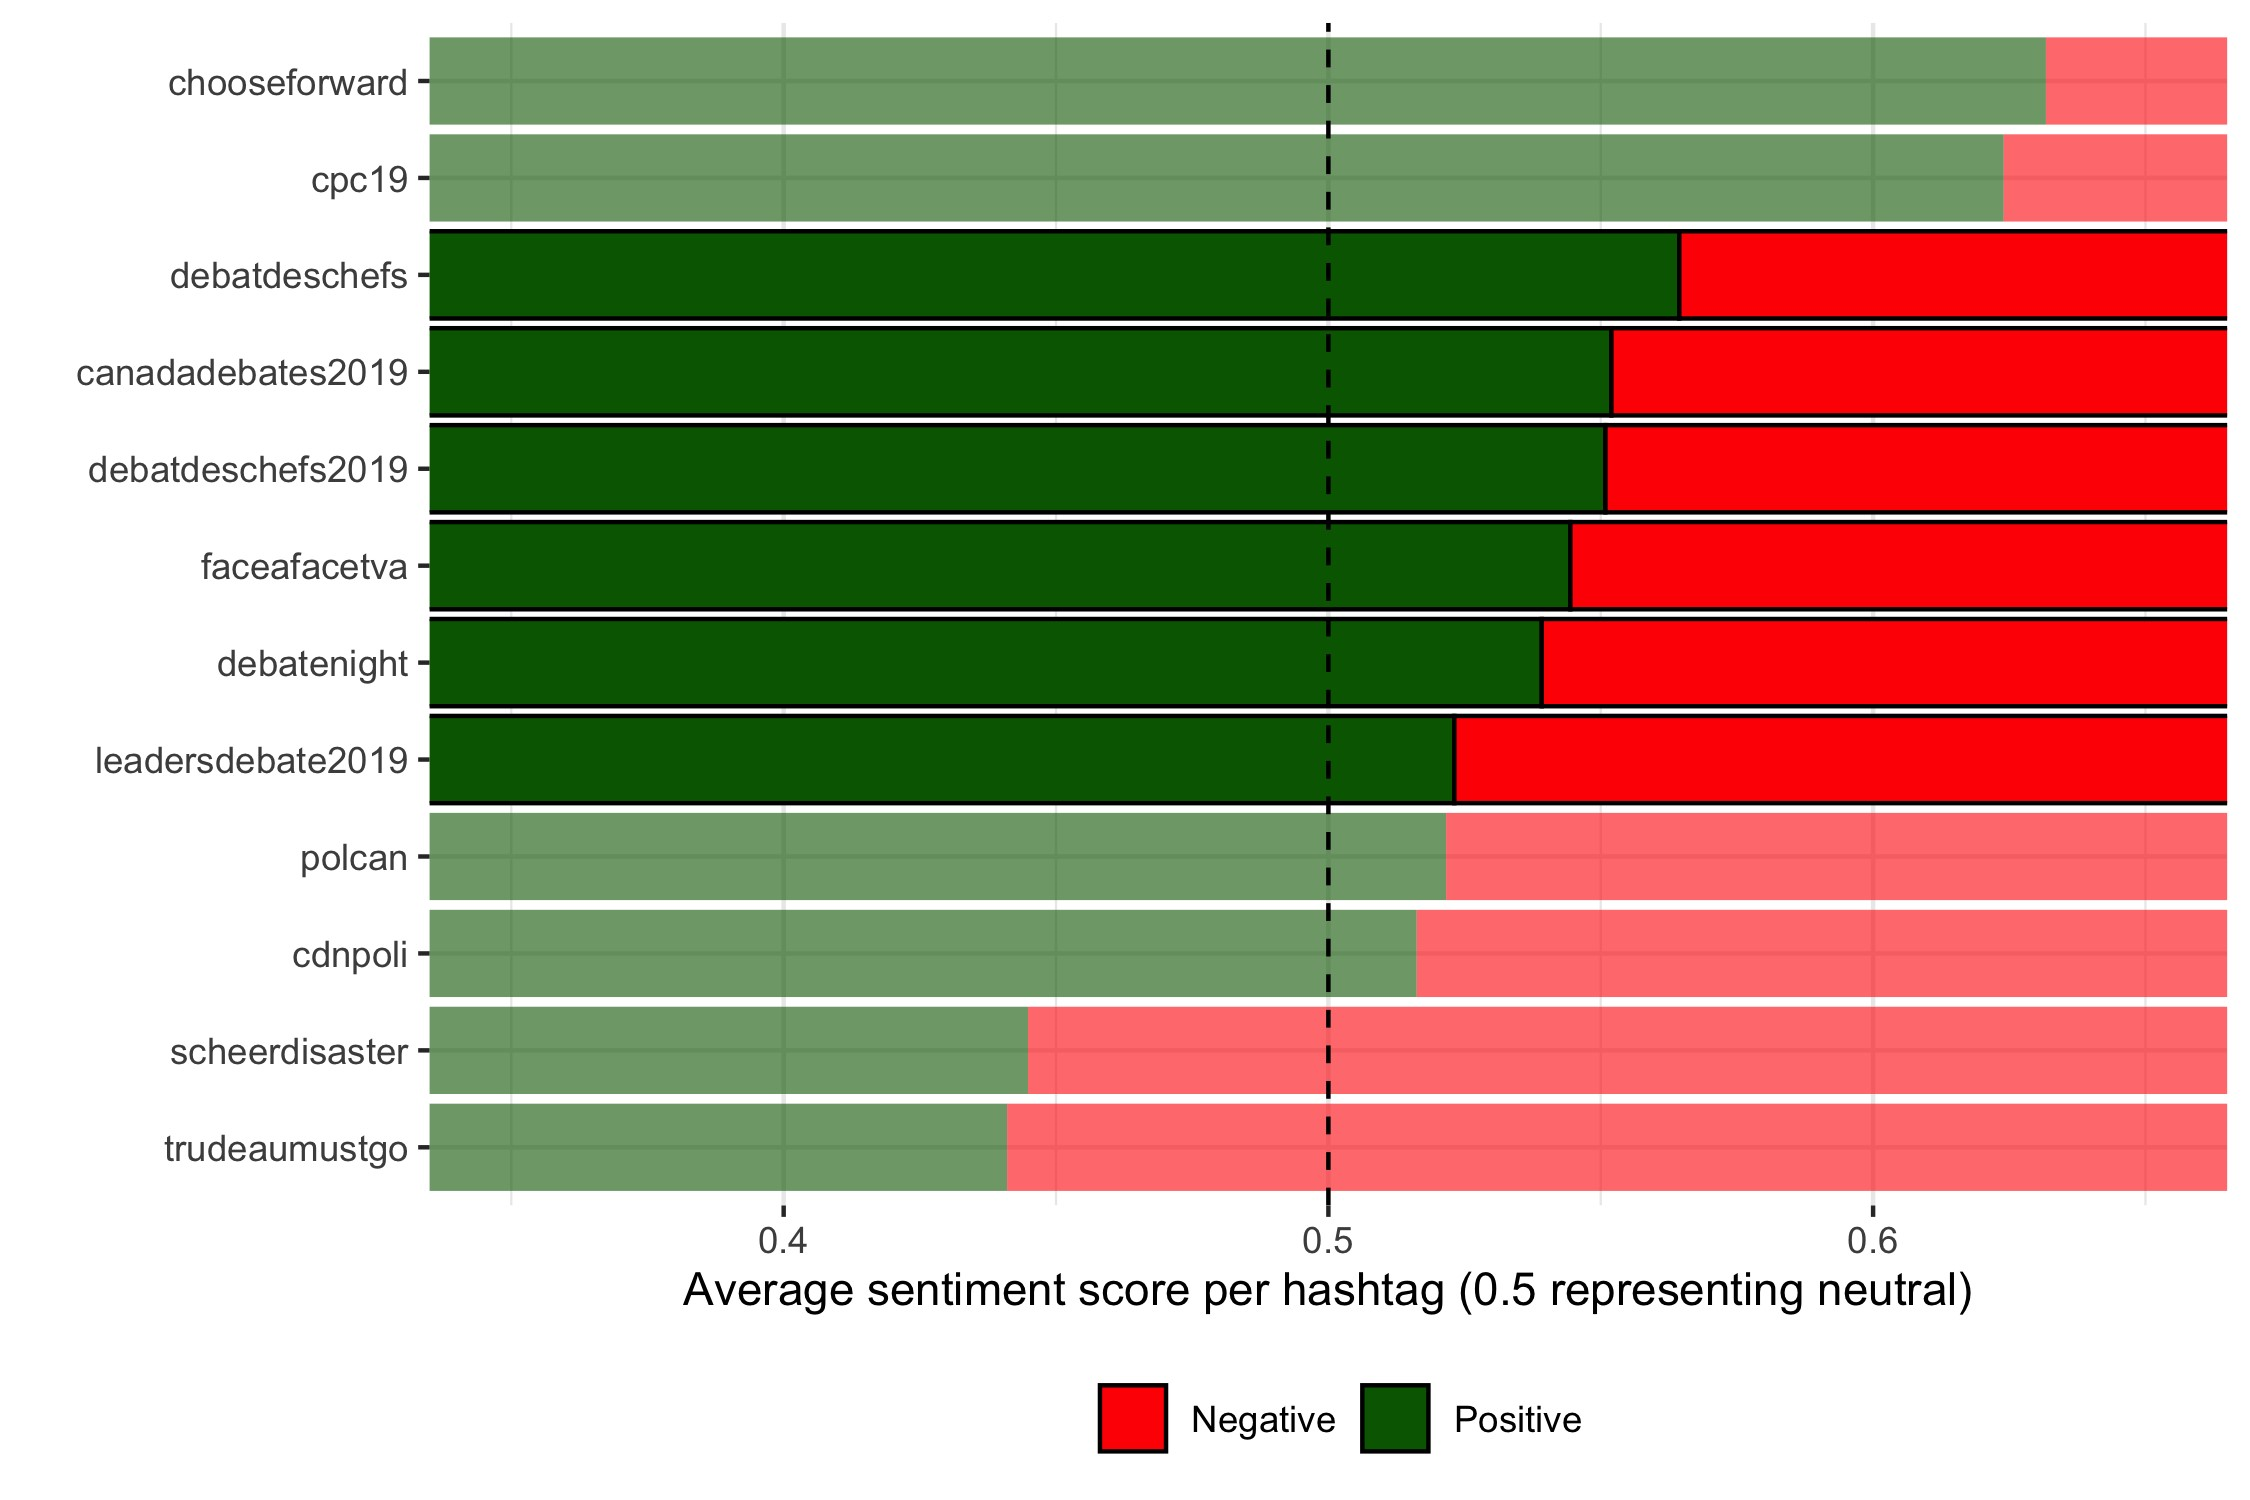 Figure 7: Sentiment evaluation of debate hashtags in comparison to popular Canadian politics hashtags
Figure 8 shows the over-time sentiment in Tweets related to the debates. Immediately following the English-language debate on the evening of the 7th there was overall positive sentiment that steadily increased until the morning of the 9th at which point there was a steady decrease. This may be the result of a negative elite-driven evaluation of the debate which seemed to appear the day following the debate and then 'trickled-down' to the mass public.
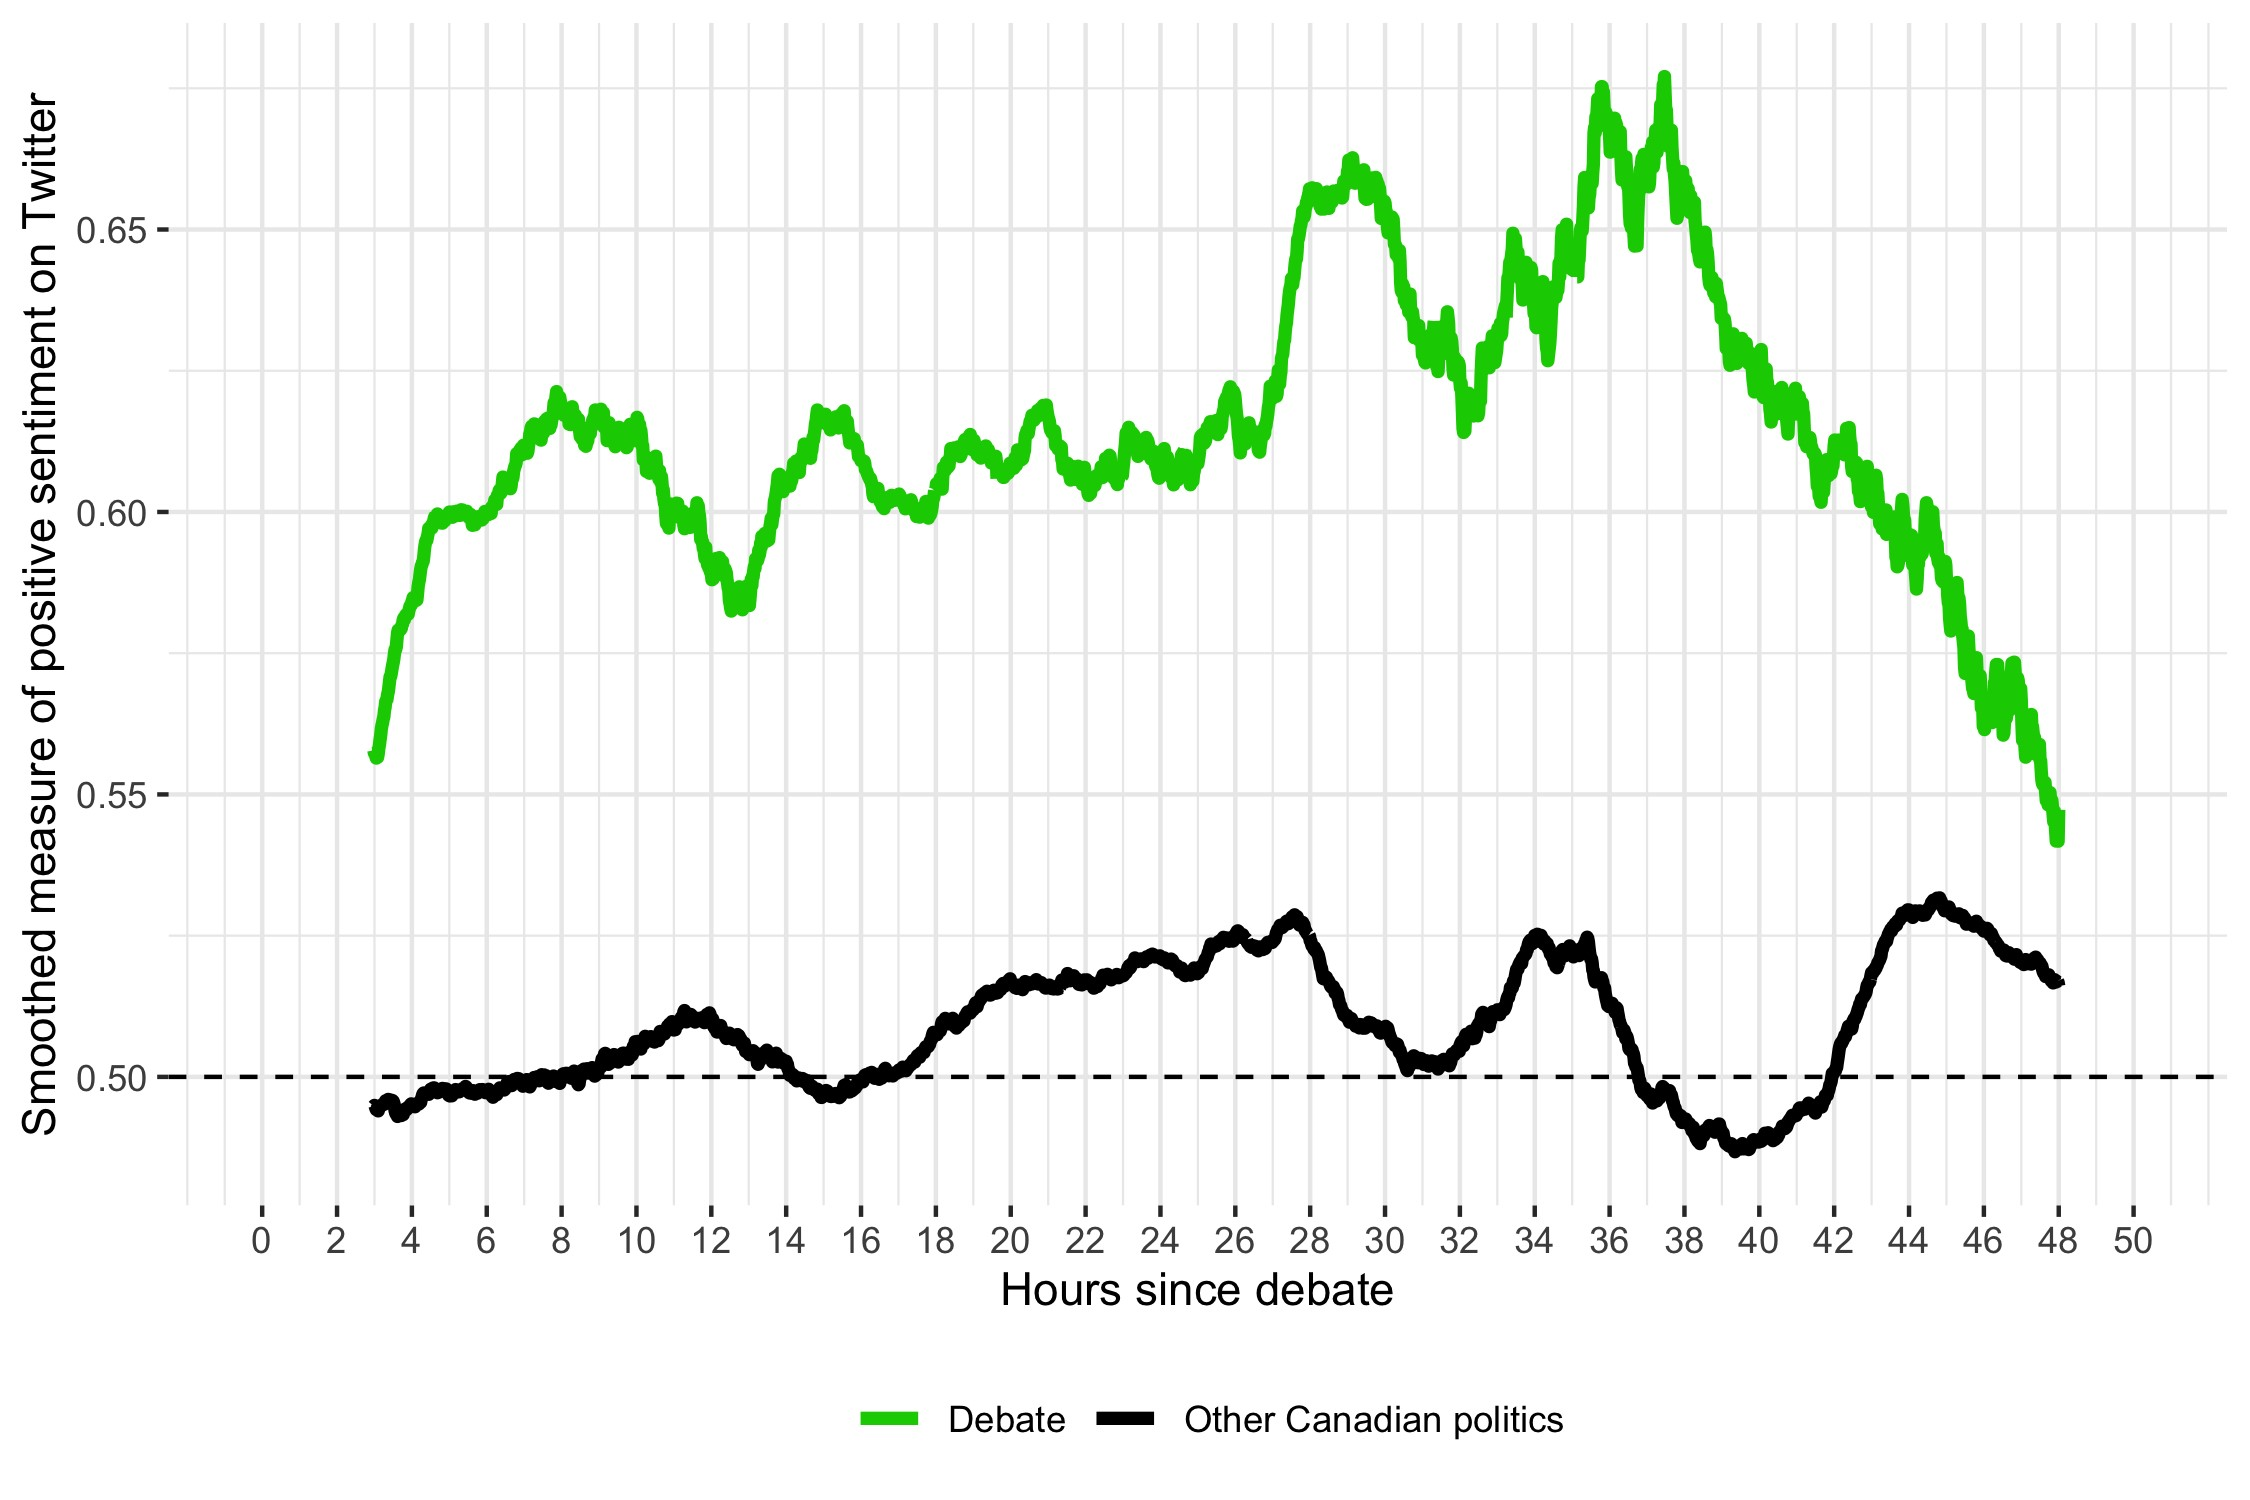
Figure 8: Sentiment evaluation of post-English debate debate-related commentary relative to that of overall discussion of Canadian politics
To test this, we examined the same sentiment over time but instead split the tweets into those of journalists and media outlets versus the general population. Figure 9 shows the overall difference in sentiment between the two populations. There are two striking findings here: 1) the sentiment of journalists is overall less positive than the mass population; and 2) the decline in positive sentiment occurred amongst journalists approximately 24 hours after the first debate and 12 hours before we saw a similar decline in the mass population. This suggests that the full Twitter population took sentiment cues from the journalists and the overall evaluation of the debate shifted in a negative direction well after the debate had concluded.
While the initial conversation during the debate was largely positive, later discussions of the English-language debate were more negative in tone.
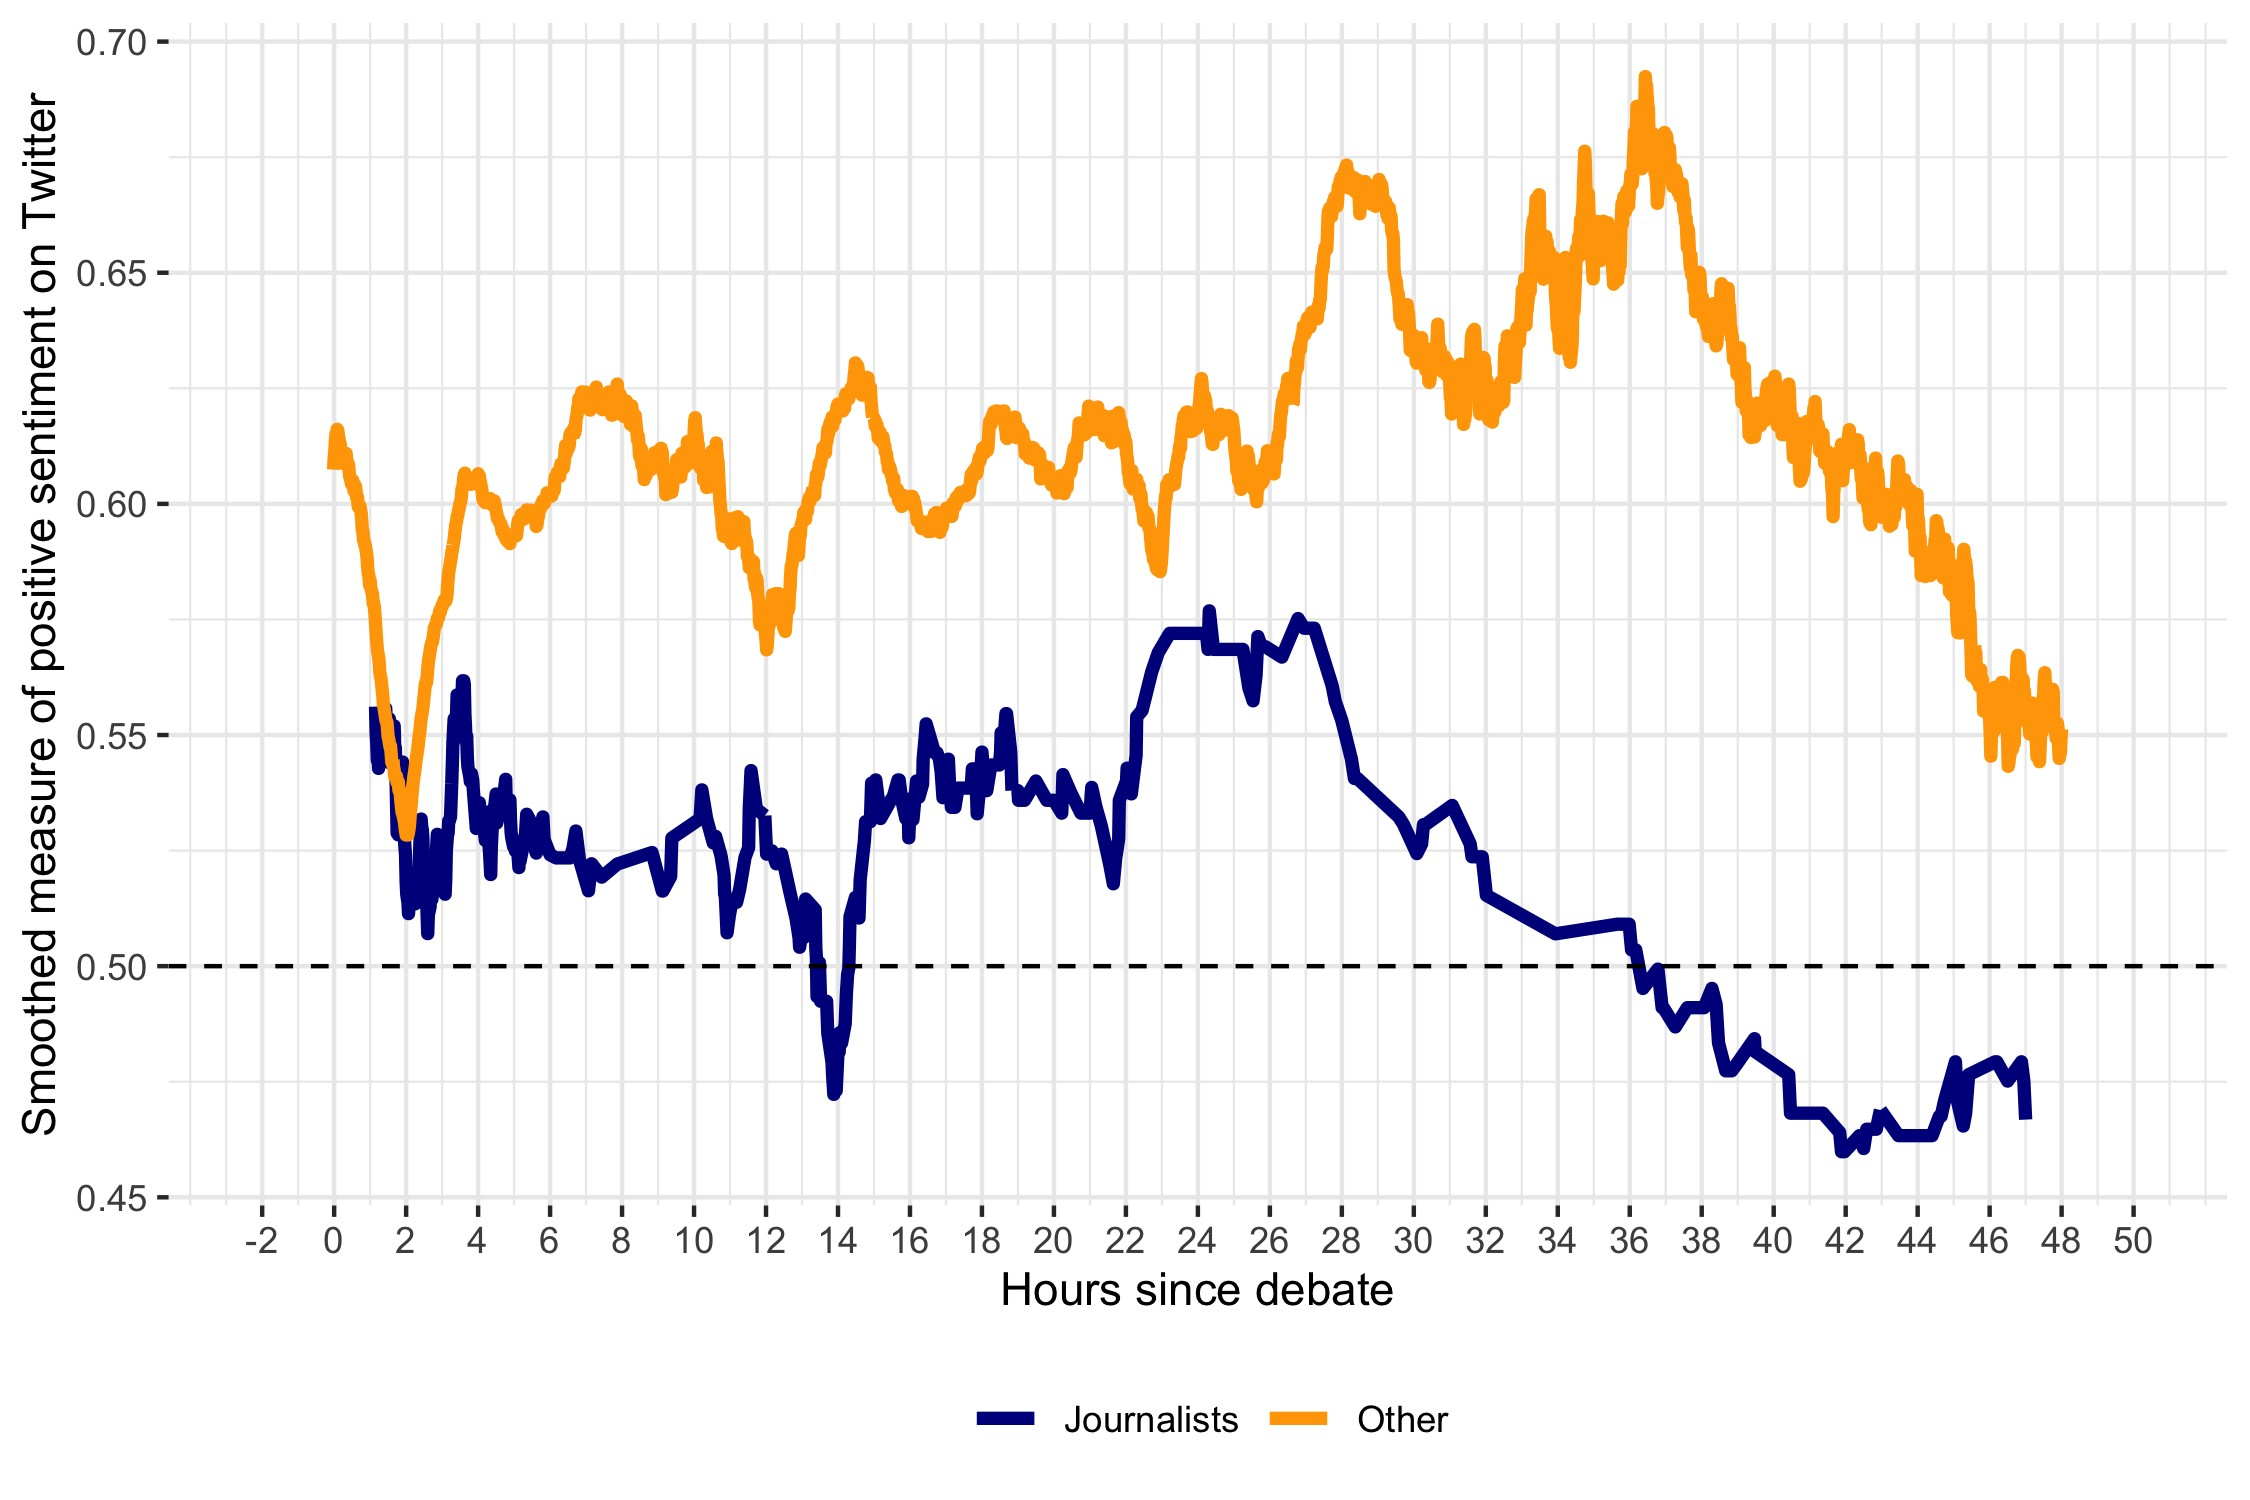
Figure 9: Sentiment evaluation of post-English debate debate-related commentary relative to that of overall discussion of Canadian politics.
7. Debate Consequences
Our study allows us to estimate several consequences of watching the leaders' debates, including on political interest, news consumption, political knowledge, and engagement with the election.
7.1. Interest in federal election and in politics generally
Table 58 estimates the effect of debate viewership on general interest in politics. We do not find a statistically significant relationship between debate viewing and changes in respondents' general interest in politics. When we ask about specific interest in the federal election, rather than general political interest, we once again fail to find a statistically significant relationship (Table 59). On balance, then, there is little evidence that debate viewership increased political interest in the short-term.
|
|
Wave 1 to Wave 2 |
|---|---|
|
Watched |
0.0139 (0.0198) |
|
Female |
0.0155 (0.0203) |
|
Age |
-0.000289 (0.000679) |
|
College |
-0.0567* (0.0253) |
|
University |
-0.0330 (0.0261) |
|
HH Income |
-0.00455 (0.00601) |
|
Constant |
0.0474 (0.0513) |
|
Observations |
2105 |
Standard errors in parentheses. Survey responses are weighted (see Methods for details.) Interest was originally measured on a 0 to 10 scale. The median response in Wave 1 was 7. The dependent variable is coded -1 if the respondent moved from above the Wave 1 median response to at or below the Wave 1 median response; 0 if the respondent remained at or below the Wave 1 median response, or remained above the Wave 1 median response; and 1 if the respondent moved from at or below the Wave 1 median response to above the Wave 1 median response. Gender, age, education, and income–all measured at Wave 1–are included as covariates. The reference categories for gender and education, respectively, are Male and High School or Less. Age and income are treated as continuous. *p < 0.05,**p < 0.01,***p < 0.001.
|
|
Wave 1 to Wave 2 |
|---|---|
|
Watched |
0.0197 (0.0209) |
|
Female |
-0.00331 (0.0211) |
|
Age |
-0.000646 (0.000753) |
|
College |
-0.0204 (0.0278) |
|
University |
0.00316 (0.0289) |
|
HH Income |
-0.00941 (0.00627) |
|
Constant |
0.0570 (0.0529) |
|
Observations |
2108 |
Standard errors in parentheses. Survey responses are weighted (see Methods for details.) Interest was originally measured on a 0 to 10 scale. The median response in Wave 1 was 7. The dependent variable is coded -1 if the respondent moved from above the Wave 1 median response to at or below the Wave 1 median response; 0 if the respondent remained at or below the Wave 1 median response, or remained above the Wave 1 median response; and 1 if the respondent moved from at or below the Wave 1 median response to above the Wave 1 median response. Gender, age, education, and income–all measured at Wave 1–are included as covariates. The reference categories for gender and education, respectively, are Male and High School or Less. Age and income are treated as continuous. *p < 0.05,**p < 0.01,***p < 0.001.
7.2. News consumption
Viewing a debate may cause individuals to pursue more information via news sources, as they seek out answers to questions raised during the debate or wish to understand media perspectives on the debate. Table 60 estimates whether individuals who watched the debate were more likely to change their general news consumption. We find no statistically significant evidence of this. However, we do find a substantial increase in news consumption about the federal election specifically. Compared to individuals who did not watch the debate, those who watched the debate had a 9-percentage point greater net increase in election news consumption (Table 61).
|
|
Wave 1 to Wave 2 |
|---|---|
|
Watched |
-0.0100 (0.0219) |
|
Female |
0.00361 (0.0226) |
|
Age |
-0.00139 (0.000710) |
|
College |
0.0514 (0.0272) |
|
University |
0.0229 (0.0287) |
|
HH Income |
-0.00107 (0.00666) |
|
Constant |
0.0610 (0.0482) |
|
Observations |
2213 |
Standard errors in parentheses. Survey responses are weighted (see Methods for details). News consumption was originally measured on a 1 to 6 scale. The median response in Wave 1 was 3. The dependent variable is coded -1 if the respondent moved from above the Wave 1 median response to at or below the Wave 1 median response; 0 if the respondent remained at or below the Wave 1 median response, or remained above the Wave 1 median response; and 1 if the respondent moved from at or below the Wave 1 median response to above the Wave 1 median response. Gender, age, education, and income–all measured at Wave 1–are included as covariates. The reference categories for gender and education, respectively, are Male and High School or Less. Age and income are treated as continuous. *p < 0.05,**p < 0.01,***p < 0.001.
|
|
Wave 1 to Wave 2 |
|---|---|
|
Watched |
0.0925*** (0.0229) |
|
Female |
0.0311 (0.0225) |
|
Age |
-0.000412 (0.000695) |
|
College |
-0.0335 (0.0288) |
|
University |
-0.0365 (0.0304) |
|
HH Income |
-0.00503 (0.00656) |
|
Constant |
0.0366 (0.0534) |
|
Observations |
2244 |
Standard errors in parentheses. Survey responses are weighted (see Methods for details). News consumption was originally measured on a 0 to 4 scale. The median response in Wave 1 was 1. The dependent variable is coded -1 if the respondent moved from above the Wave 1 median response to at or below the Wave 1 median response; 0 if the respondent remained at or below the Wave 1 median response, or remained above the Wave 1 median response; and 1 if the respondent moved from at or below the Wave 1 median response to above the Wave 1 median response. Gender, age, education, and income–all measured at Wave 1–are included as covariates. The reference categories for gender and education, respectively, are Male and High School or Less. Age and income are treated as continuous. *p < 0.05,**p < 0.01,***p < 0.001.
7.3. Knowledge
7.3.1. Election date and where to vote
We asked respondents about the technical details of the election – if they knew the date of the election and if they knew where to vote. We find that while debate viewers did increase their knowledge on the date of the election in the period between Waves 1 and 2, the increase was greater among non-debate viewers (Table 62). That said, this is largely an artefact of those who watched the debates already exhibiting high levels of knowledge about the election date. Indeed, among those who reported watching a debate in Wave 2, 87% already knew the correct election date prior to the debate (by comparison, only 69% of individuals who reported not watching a debate in Wave 2 knew the correct election date prior to the debate).
Table 63 presents estimates of the effects of watching the debate on knowledge of one's polling place. We find no difference between debate viewers and non-viewers, though both groups increased in self-reported knowledge about polling place location in the time between the two surveys.
|
|
Wave 1 to Wave 2 |
|---|---|
|
Watched |
-0.0686*** (0.0192) |
|
Female |
0.0535** (0.0199) |
|
Age |
-0.0000520 (0.000696) |
|
College |
-0.0729* (0.0291) |
|
University |
-0.0917** (0.0295) |
|
HH Income |
0.00357 (0.00643) |
|
Constant |
0.173***(0.0520) |
|
Observations |
2244 |
Standard errors in parentheses. Survey responses are weighted (see Methods for details). The dependent variable is coded -1 if the respondent moved from knowing the correct answer to not knowing the correct answer; 0 if the respondent did not know the correct answer in both waves, or knew the correct answer in both waves; and 1 if the respondent moved from not knowing the correct answer to knowing the correct answer. Gender, age, education, and income–all measured at Wave 1–are included as covariates. The reference categories for gender and education, respectively, are Male and High School or Less. Age and income are treated as continuous. *p < 0.05,**p < 0.01,***p < 0.001.
|
|
Wave 1 to Wave 2 |
|---|---|
|
Watched |
-0.0126 (0.0159) |
|
Female |
0.0169 (0.0180) |
|
Age |
-0.00121* (0.000524) |
|
College |
0.00994 (0.0244) |
|
University |
-0.000845 (0.0244) |
|
HH Income |
0.00544 (0.00588) |
|
Constant |
0.104* (0.0442) |
|
Observations |
2244 |
Standard errors in parentheses. Survey responses are weighted (see Methods for details). The dependent variable is coded -1 if the respondent moved from knowing where to vote to not knowing where to vote; 0 if the respondent did not know where to vote in both waves, or knew where to vote in both waves; and 1 if the respondent moved from not knowing where to vote to knowing where to vote. Gender, age, education, and income–all measured at Wave 1–are included as covariates. The reference categories for gender and education, respectively, are Male and High School or Less. Age and income are treated as continuous. *p < 0.05,**p < 0.01,***p < 0.001.
7.3.2. Current economic and social conditions
We quizzed individuals about their knowledge of objective current social and economic conditions. In particular, we asked them the following:
- Is Canada on track to meet its climate change commitments under the Paris Accord? (Correct answer: No)
- On average, does Canada admit more or less refugees as a percentage of the population than the United States? (Correct answer: More)
- Is the number of all immigrants (including refugees) admitted to Canada in 2018 higher or lower than in 2015? (Correct answer: Higher)
- Does a Canadian family with two children earning $50,000 receive more in monthly payments from the federal government in 2018 than in 2015, or less? (Correct answer: More in 2018)
- Was the federal deficit in 2018 greater than the federal deficit in 2015? (Correct answer: Greater in 2018)
- Was the unemployment rate lower in 2018 or in 2015? (Correct answer: Lower in 2018)
We find no measurable difference between debate watchers and non-watchers in terms of their change in knowledge about these items (Table 64).
|
|
Wave 1 to Wave 2 |
|---|---|
|
Watched |
0.0271 (0.0252) |
|
Female |
-0.0255 (0.0243) |
|
Age |
-0.000567 (0.000819) |
|
College |
-0.0653* (0.0323) |
|
University |
-0.0246 (0.0319) |
|
HH Income |
0.00877 (0.00800) |
|
Constant |
0.0657 (0.0539) |
|
Observations |
2244 |
Standard errors in parentheses. Survey responses are weighted (see Methods for details). Knowledge was originally measured on a 0 to 6 scale. The median response in Wave 1 was 4. The dependent variable is coded -1 if the respondent moved from above the Wave 1 median response to at or below the Wave 1 median response; 0 if the respondent remained at or below the Wave 1 median response, or remained above the Wave 1 median response; and 1 if the respondent moved from at or below the Wave 1 median response to above the Wave 1 median response. Gender, age, education, and income–all measured at Wave 1–are included as covariates. The reference categories for gender and education, respectively, are Male and High School or Less. Age and income are treated as continuous. *p < 0.05,**p < 0.01,***p < 0.001.
7.3.3. Party platforms
We also quizzed voters about their knowledge of party promises. We presented voters with six promises forwarded by parties during the campaign. We then asked them to attribute promises to parties. Prior to the debate, the median number of correct attributions was 2 (out of 6 promises). According to our estimates in Table 65, debate viewers demonstrated a clear improvement over non-viewers in their ability to make more than the median number of correct promise attributions. Compared to non-viewers, debate viewers experienced a 10-percentage point greater net increase in party platform knowledge following the debates. In short, debate viewership increased knowledge of parties' promises.
|
|
Wave 1 to Wave 2 |
|---|---|
|
Watched |
0.101***(0.0249) |
|
Female |
0.0486*(0.0244) |
|
Age |
-0.000148 (0.000817) |
|
College |
-0.00492 (0.0316) |
|
University |
-0.0174 (0.0308) |
|
HH Income |
0.0151 (0.00774) |
|
Constant |
-0.0387 (0.0556) |
|
Observations |
2244 |
Standard errors in parentheses. Survey responses are weighted (see Methods for details). Knowledge was originally measured on a 0 to 6 scale. The median response in Wave 1 was 2. The dependent variable is coded -1 if the respondent moved from above the Wave 1 median response to at or below the Wave 1 median response; 0 if the respondent remained at or below the Wave 1 median response, or remained above the Wave 1 median response; and 1 if the respondent moved from at or below the Wave 1 median response to above the Wave 1 median response. Gender, age, education, and income–all measured at Wave 1–are included as covariates. The reference categories for gender and education, respectively, are Male and High School or Less. Age and income are treated as continuous. * p < 0.05, ** p < 0.01, *** p < 0.001.
7.4. Self-reported confidence in knowing enough to vote
Finally, we asked respondents if they felt that were confident that they could make a good voting decision. According to our estimates in Table 66, we find no differences between watchers and non-watchers with respect to changes in this self-reported confidence.
|
|
Wave 1 to Wave 2 |
|---|---|
|
Watched |
0.00225 (0.0235) |
|
Female |
0.0318 (0.0232) |
|
Age |
0.000847 (0.000807) |
|
College |
-0.0493 (0.0325) |
|
University |
-0.0662 (0.0338) |
|
HH Income |
0.0104 (0.00765) |
|
Constant |
-0.0425 (0.0628) |
|
Observations |
2097 |
Standard errors in parentheses. Survey responses are weighted (see Methods for details). Confidence was originally measured on a 0 to 10 scale. The median response in Wave 1 was 7. The dependent variable is coded -1 if the respondent moved from above the Wave 1 median response to at or below the Wave 1 median response; 0 if the respondent remained at or below the Wave 1 median response, or remained above the Wave 1 median response; and 1 if the respondent moved from at or below the Wave 1 median response to above the Wave 1 median response. Gender, age, education, and income–all measured at Wave 1–are included as covariates. The reference categories for gender and education, respectively, are Male and High School or Less. Age and income are treated as continuous. * p < 0.05, ** p < 0.01, *** p < 0.001.
7.5. Democratic satisfaction
We asked respondents about their general satisfaction with Canadian democracy. We find that debate viewership is unrelated to changes in democratic satisfaction over this period (Table 67).
|
|
Wave 1 to Wave 2 |
|---|---|
|
Watched |
0.0209 (0.0172) |
|
Female |
0.0177 (0.0170) |
|
Age |
0.000271 (0.000575) |
|
College |
-0.0167 (0.0226) |
|
University |
-0.0260 (0.0236) |
|
HH Income |
0.0103 (0.00588) |
|
Constant |
-0.0797 (0.0413) |
|
Observations |
2141 |
Standard errors in parentheses. Survey responses are weighted (see Methods for details). Satisfaction was originally measured on a 0 to 3 scale. The median response in Wave 1 was 2. The dependent variable is coded -1 if the respondent moved from above the Wave 1 median response to at or below the Wave 1 median response; 0 if the respondent remained at or below the Wave 1 median response, or remained above the Wave 1 median response; and 1 if the respondent moved from at or below the Wave 1 median response to above the Wave 1 median response. Gender, age, education, and income–all measured at Wave 1–are included as covariates. The reference categories for gender and education, respectively, are Male and High School or Less. Age and income are treated as continuous. * p < 0.05, ** p < 0.01, *** p < 0.001.
7.6. Confidence in democratic institutions
We also queried respondents on their faith in Canadian democratic institutions. In this instance, we actually find a decrease in confidence among debate viewers versus nonviewers. According to our estimates in Table 68, we find that debate viewers experienced a 4.6 percentage point greater net decline in their confidence in democratic institutions– compared to non-viewers.
We also explored debate effects on trust in political parties to provide factual information. We find no measurable difference between viewers and non-viewers on this metric (Table 69).
|
|
Wave 1 to Wave 2 |
|---|---|
|
Watched |
-0.0459* (0.0213) |
|
Female |
-0.0547* (0.0215) |
|
Age |
-0.000820 (0.000706) |
|
College |
0.0463 (0.0304) |
|
University |
0.00873 (0.0286) |
|
HH Income |
0.000684 (0.00751) |
|
Constant |
0.0635 (0.0516) |
|
Observations |
2179 |
Standard errors in parentheses. Survey responses are weighted (see Methods for details). Confidence was originally measured on a 0 to 3 scale. The median response in Wave 1 was 1.25. The dependent variable is coded -1 if the respondent moved from above the Wave 1 median response to at or below the Wave 1 median response; 0 if the respondent remained at or below the Wave 1 median response, or remained above the Wave 1 median response; and 1 if the respondent moved from at or below the Wave 1 median response to above the Wave 1 median response. Gender, age, education, and income–all measured at Wave 1–are included as covariates. The reference categories for gender and education, respectively, are Male and High School or Less. Age and income are treated as continuous. * p < 0.05, ** p < 0.01, *** p < 0.001.
|
|
Wave 1 to Wave 2 |
|---|---|
|
Watched |
-0.0154 (0.0234) |
|
Female |
-0.00527 (0.0242) |
|
Age |
0.000547 (0.000747) |
|
College |
-0.0172 (0.0352) |
|
University |
-0.00469 (0.0322) |
|
HH Income |
-0.000910 (0.00696) |
|
Constant |
-0.0172 (0.0543) |
|
Observations |
1984 |
Standard errors in parentheses. Survey responses are weighted (see Methods for details). Trust was originally measured on a 0 to 10 scale. The median response in Wave 1 was 4. The dependent variable is coded -1 if the respondent moved from above the Wave 1 median response to at or below the Wave 1 median response; 0 if the respondent remained at or below the Wave 1 median response, or remained above the Wave 1 median response; and 1 if the respondent moved from at or below the Wave 1 median response to above the Wave 1 median response. Gender, age, education, and income–all measured at Wave 1–are included as covariates. The reference categories for gender and education, respectively, are Male and High School or Less. Age and income are treated as continuous. * p < 0.05, ** p < 0.01, *** p < 0.001.
7.7. Political efficacy
Having watched the debate and learned about parties and their positions, viewers may then feel more confident in the responsiveness of democratic institutions and in their own ability to understand and influence politics. This is typically referred to as efficacy. However, following Table 70, we find no effect of debate viewership on changes in voters' sense of political efficacy over this period.
|
|
Wave 1 to Wave 2 |
|---|---|
|
Watched |
0.00679 (0.0225) |
|
Female |
0.0276 (0.0233) |
|
Age |
-0.000114 (0.000787) |
|
College |
-0.0359 (0.0327) |
|
University |
0.00566 (0.0337) |
|
HH Income |
0.000837 (0.00776) |
|
Constant |
0.000367 (0.0602) |
|
Observations |
2226 |
Standard errors in parentheses. Survey responses are weighted (see Methods for details). Efficacy was originally measured on a 0 to 3 scale. The median response in Wave 1 was 1. The dependent variable is coded -1 if the respondent moved from above the Wave 1 median response to at or below the Wave 1 median response; 0 if the respondent remained at or below the Wave 1 median response, or remained above the Wave 1 median response; and 1 if the respondent moved from at or below the Wave 1 median response to above the Wave 1 median response. Gender, age, education, and income–all measured at Wave 1–are included as covariates. The reference categories for gender and education, respectively, are Male and High School or Less. Age and income are treated as continuous. * p < 0.05, ** p < 0.01, *** p < 0.001.
7.8. Discussion of federal election
Table 71 presents our estimates of the effect of debate viewership on discussion of the federal election. Reflecting our finding of increased news consumption about the election in Table 61, we find that, compared to non-viewers, debate viewers had an 8.5 percentage point greater net increase in discussion about the federal election following the debates.
|
|
Wave 1 to Wave 2 |
|---|---|
|
Watched |
0.0846*** (0.0249) |
|
Female |
-0.0222 (0.0240) |
|
Age |
0.0000512 (0.000818) |
|
College |
-0.000306 (0.0334) |
|
University |
0.0187 (0.0340) |
|
HH Income |
0.00745 (0.00769) |
|
Constant |
-0.0240 (0.0567) |
|
Observations |
2244 |
Standard errors in parentheses. Survey responses are weighted (see Methods for details). Discussion was originally measured on a to 3 scale. The median response in Wave 1 was 0. The dependent variable is coded -1 if the respondent moved from above the Wave 1 median response to at or below the Wave 1 median response; 0 if the respondent remained at or below the Wave 1 median response, or remained above the Wave 1 median response; and 1 if the respondent moved from at or below the Wave 1 median response to above the Wave 1 median response. Gender, age, education, and income–all measured at Wave 1–are included as covariates. The reference categories for gender and education, respectively, are Male and High School or Less. Age and income are treated as continuous. * p < 0.05, ** p < 0.01, *** p < 0.001.
7.9. Turnout intention and vote choice
We find no difference in the change in intended turnout between debate viewers and non-viewers (Table 72). We likewise find no measurable difference between viewers and non-viewers with respect to change in vote intention–i.e., choice of party (Table 73).
|
|
Wave 1 to Wave 2 |
|---|---|
|
Watched |
-0.0131 (0.0160) |
|
Female |
0.0169 (0.0169) |
|
Age |
0.0000225 (0.000568) |
|
College |
0.00239 (0.0215) |
|
University |
-0.00228 (0.0244) |
|
HH Income |
-0.00762 (0.00570) |
|
Constant |
0.0159 (0.0458) |
|
Observations |
2235 |
Standard errors in parentheses. Survey responses are weighted (see Methods for details). The dependent variable is coded -1 if the respondent moved from certain to vote to not certain to vote; 0 if the respondent remained not certain to vote or remained certain to vote; and 1 if the respondent moved from not certain to vote to certain to vote. Gender, age, education, and income–all measured at Wave 1–are included as covariates. The reference categories for gender and education, respectively, are Male and High School or Less. Age and income are treated as continuous. * p < 0.05, ** p < 0.01, *** p < 0.001.
|
|
Wave 1 to Wave 2 |
|---|---|
|
Watched |
0.0123 (0.0199) |
|
Female |
0.00815 (0.0209) |
|
Age |
-0.00222*** (0.00065) |
|
College |
0.0107 (0.0283) |
|
University |
0.0244 (0.0281) |
|
HH Income |
-0.0164* (0.00687) |
|
Constant |
0.327*** (0.0524) |
|
Observations |
2174 |
Standard errors in parentheses. Survey responses are weighted (see Methods for details). The dependent variable is coded 0 if the respondent reported the same vote choice; and 1 if the respondent reported a different vote choice. Gender, age, education, and income–all measured at Wave 1–are included as covariates. The reference categories for gender and education, respectively, are Male and High School or Less. Age and income are treated as continuous. *p < 0.05, **p < 0.01, ***p < 0.001
7.10. Party Evaluations
7.10.1. Feeling thermometers
Did the debates help voters update their evaluations of parties? On this measure, we find a clear effect. We asked respondents to rate every party on a feeling thermometer from 0 to 100 in both waves of our survey. We then observe the differences between these scores and calculate an average absolute change. Essentially, this recovers a measure in overall change in leader ratings without estimating the direction of these changes. We find that viewers were significantly more likely to change their evaluations of parties than non-viewers, though the effect is not substantively very large (Table 74). We later find that debate viewers also show more updating in their leader ratings (Table 78).
|
|
Wave 1 to Wave 2 |
|---|---|
|
Watched |
0.971** (0.365) |
|
Female |
0.178 (0.392) |
|
Age |
-0.0236* (0.0117) |
|
College |
0.388 (0.574) |
|
University |
-0.129 (0.552) |
|
HH Income |
0.0288 (0.121) |
|
Constant |
11.09***(0.944) |
|
Observations |
2151 |
Standard errors in parentheses. Survey responses are weighted (see Methods for details).
Respondents originally rated each party on a 0 to 100 scale. The dependent variable is the absolute difference in these party ratings between waves, averaged across the parties for each respondent. This scale of average absolute differences ranges from 0 to 80. Gender, age, education, and income–all measured at Wave 1–are included as covariates. The reference categories for gender and education, respectively, are Male and High School or Less. Age and income are treated as continuous. *p < 0.05, **p < 0.01, ***p < 0.001.
7.10.2. Party placement on left-right scale
While viewers did show a greater change in their party evaluations, we find no significant differences between viewers and non-viewers with respect to changes in their average placements of the parties on a left-right dimension (Table 75) or changes in their ability to place parties on that dimension in the first place (Table 76).
|
|
Wave 1 to Wave 2 |
|---|---|
|
Watched |
0.00305 (0.0673) |
|
Female |
0.0388 (0.0717) |
|
Age |
-0.00105 (0.00224) |
|
College |
-0.0668 (0.103) |
|
University |
-0.0114 (0.101) |
|
HH Income |
-0.00486 (0.0235) |
|
Constant |
1.391*** (0.182) |
|
Observations |
1785 |
Standard errors in parentheses. Survey responses are weighted (see Methods for details).
Respondents originally placed each party on a 0 to 10 scale. The dependent variable is the absolute difference in these party placements between waves, averaged across the parties for each respondent. This scale of average absolute differences ranges from 0 to 10. Gender, age, education, and income–all measured at Wave 1–are included as covariates. The reference categories for gender and education, respectively, are Male and High School or Less. Age and income are treated as continuous. * p < 0.05, ** p < 0.01, *** p < 0.001.
|
|
Wave 1 to Wave 2 |
|---|---|
|
Watched |
0.0239 (0.0217) |
|
Female |
-0.0171 (0.0222) |
|
Age |
0.000383 (0.000716) |
|
College |
-0.0483 (0.0313) |
|
University |
-0.0184 (0.0318) |
|
HH Income |
-0.000844 (0.00759) |
|
Constant |
0.0424 (0.0537) |
|
Observations |
2244 |
Standard errors in parentheses. Survey responses are weighted (see Methods for details).
In Wave 1, most respondents were able to place all six parties. The dependent variable is coded -1 if the respondent moved from placing all six parties to placing less than six parties; 0 if the respondent placed less than six parties in both waves, or placed all six parties in both waves; and 1 if the respondent moved from placing less than six parties to placing all six parties. Gender, age, education, and income–all measured at Wave 1–are included as covariates. The reference categories for gender and education, respectively, are Male and High School or Less. Age and income are treated as continuous. * p < 0.05, ** p < 0.01, *** p < 0.001.
7.10.3. Best party to handle most important issue
We find no evidence that viewers were more likely than non-viewers to change their evaluation of which party was best suited to address the respondents' most important issue (Table 77).
|
|
Wave 1 to Wave 2 |
|---|---|
|
Watched |
0.0207 (0.0233) |
|
Female |
0.0281 (0.0238) |
|
Age |
-0.00105 (0.000740) |
|
College |
0.0268 (0.0334) |
|
University |
-0.0372 (0.0322) |
|
HH Income |
-0.0141 (0.00763) |
|
Constant |
0.424*** (0.0572) |
|
Observations |
2244 |
Standard errors in parentheses. Survey responses are weighted (see Methods for details). The dependent variable is coded 0 if the respondent gave the same response in both waves; and 1 if the respondent gave a different response. Gender, age, education, and income–all measured at Wave 1–are included as covariates. The reference categories for gender and education, respectively, are Male and High School or Less. Age and income are treated as continuous. *p < 0.05, **p < 0.01, ***p < 0.001.
7.11. Evaluations of the party leaders
|
|
Wave 1 to Wave 2 |
|---|---|
|
Watched |
0.739 (0.385) |
|
Female |
0.343 (0.422) |
|
Age |
-0.0108 (0.0125) |
|
College |
-0.866 (0.617) |
|
University |
-0.412 (0.622) |
|
HH Income |
0.142 (0.144) |
|
Constant |
10.86*** (1.095) |
|
Observations |
2111 |
Standard errors in parentheses. Survey responses are weighted (see Methods for details).
Respondents originally rated each leader on a 0 to 100 scale. The dependent variable is the absolute difference in these party leader ratings between waves, averaged across the leaders for each respondent. This scale of average absolute differences ranges from 0 to 78. Gender, age, education, and income–all measured at Wave 1–are included as covariates. The reference categories for gender and education, respectively, are Male and High School or Less. Age and income are treated as continuous. * p < 0.05, ** p < 0.01, *** p < 0.001.
7.12. Non-voting forms of political participation
We asked respondents how likely they would be to participate in non-voting forms of political participation (e.g., attending a political meeting, using social media to discuss politics, or signing a petition) over the next 12 months. We find that debate viewers report a significant increase in these expected activities in comparison to non-viewers. Namely, compared to non-viewers, debate viewers experienced a 5.7 percentage point greater net increase in expected future participation (Table 79).
|
|
Wave 1 to Wave 2 |
|---|---|
|
Watched |
0.0568** (0.0213) |
|
Female |
0.0199 (0.0205) |
|
Age |
-0.000860 (0.000663) |
|
College |
-0.0135 (0.0283) |
|
University |
-0.0167 (0.0304) |
|
HH Income |
-0.00687 (0.00662) |
|
Constant |
-0.00464 (0.0501) |
|
Observations |
2203 |
Standard errors in parentheses. Survey responses are weighted (see Methods for details). Participation was originally measured on a 0 to 3 scale. The median response in Wave 1 was 0.37. The dependent variable is coded -1 if the respondent moved from above the Wave 1 median response to at or below the Wave 1 median response; 0 if the respondent remained at or below the Wave 1 median response, or remained above the Wave 1 median response; and 1 if the respondent moved from at or below the Wave 1 median response to above the Wave 1 median response. Gender, age, education, and income–all measured at Wave 1–are included as covariates. The reference categories for gender and education, respectively, are Male and High School or Less. Age and income are treated as continuous. *p < 0.05, **p < 0.01, ***p < 0.001.
8. Future debates
8.1. Conjoint experiment eliciting preferences about hypothetical debate formats
What do voters want from debates? In addition to estimating the effects of debates, we also aimed to ascertain what features of debates matters to voters. To ascertain this, we conducted a conjoint experiment (Hainmueller et al. 2014) in which voters were presented with 12 different hypothetical debate formats, and then asked for their likelihood of watching the debate in each format. The hypothetical debates had eight different features, namely:
- The topic, which could be foreign affairs, healthcare only, the environment only, the economy only, or the economy, healthcare, and the environment.
- The number of leaders, which could be 2, 4, or 6.
- The format for responses, whether leaders mainly responded to the moderators or to each other.
- The main source of questions, whether from journalists, policy experts, or ordinary citizens.
- Whether moderators were allowed to cut off leaders who interrupt each other.
- Whether moderators were allowed to challenge leaders' answers.
- The number of moderators, whether one, two, or five; and
- The debate language. In the experiment, this could take on one of three possible values: "English only (translation provided);" "French only (translation provided);" or "Switching between English and French (translation provided)." For the analysis, the variable was recoded to reflect the respondent's language (e.g., coded as "Own Language" when a French-speaking respondent was assessing a French-only debate or when an English-speaking respondent was assessing an English-only debate).
The conjoint approach allows us to estimate the independent effect of any single debate across all other factors (and combinations of factors).
Figure 10 presents our results. We find that respondents were significantly more likely to prefer a debate focused on the economy, healthcare, and the environment than any debate focused on one standalone issue. Compared to any other debate topics, foreign affairs was least preferred as a debate topic.
Respondents did not reveal a preference for the number of leaders present, though they appear to prefer more leaders to fewer.
Respondents were indifferent between a format in which leaders mainly respond to moderators and one in which they mainly respond to each other. They were, however, measurably more likely to watch debates in which a moderator had the power to cut off leaders who interrupt each other. There is no clear preference for moderators that are empowered to challenge leaders' answers.
We find clear evidence that respondents prefer a single moderator to multiple moderators.
Finally, we find that respondents express a strong preference for a debate conducted in their own language as opposed to one conducted in the other official language. They also express less enthusiasm about bilingual debates, though this effect is not as stark.
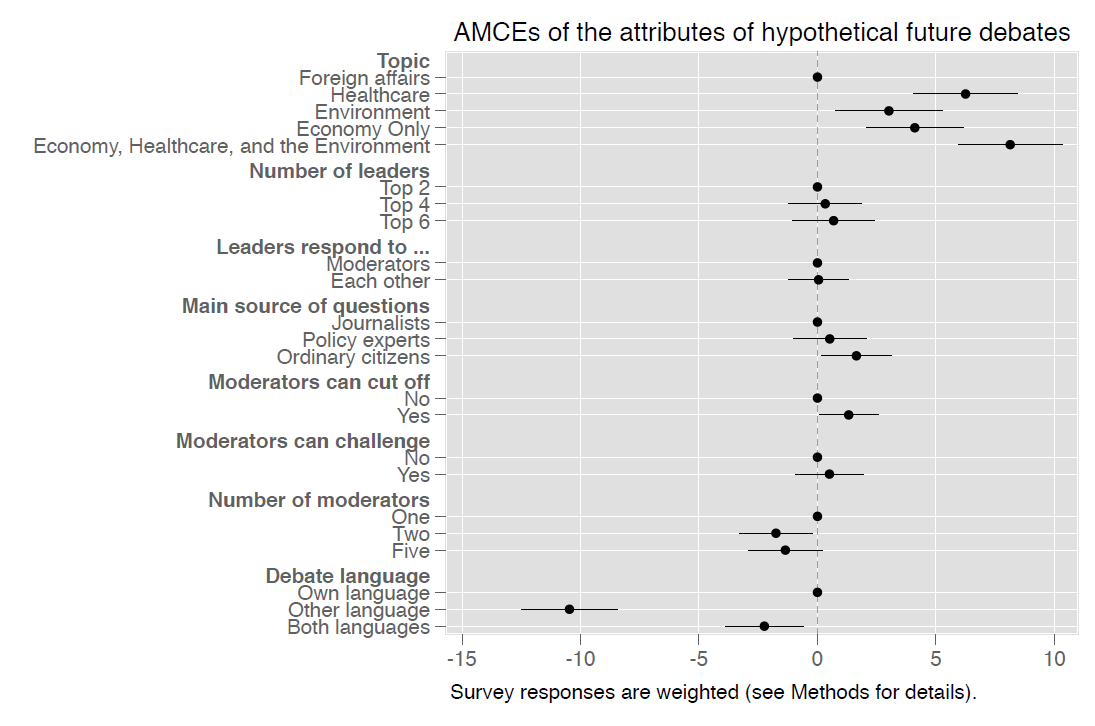
Figure 10 - AMCEs of the attributes of hypothetical future debates
8.2. How to select which leaders to invite to participate in debates
In addition to probing respondents' preferences over various debate formats, we also asked them to evaluate the criteria on which parties could be selected to participate in debates. We presented respondents with six different criteria and asked them to rank them. Table 80 presents the criteria and average rank, where lower numbers indicate a greater preference for any single criterion. Respondents most preferred the number of ridings a party is competing in, followed by their poll standings. The number of MPs held the third highest rank, while the size of a party's membership was next. The standalone judgments of debate organizers received the second lowest rank. The clearly least preferred metric was the number of donors.
|
|
Mean Rank |
|---|---|
|
Number of ridings with candidates |
2.71 |
|
Support in polls |
2.92 |
|
Number of MPs |
3.03 |
|
Size of membership |
3.71 |
|
Judgments of debate organizers |
3.78 |
|
Number of donors |
4.85 |
|
Observations |
1006 |
Survey responses are weighted (see Methods for details).
8.3. Requirement for broadcasters to carry debates
Thinking again about the next federal election, we asked respondents whether TV broadcasters should be required by law to broadcast the federal leaders' debate. Table 81 shows that a majority of Canadians, 57%, thought they should.
|
|
Percent |
Standard error |
N |
|---|---|---|---|
|
Yes |
57.10 |
1.83 |
599 |
|
No |
24.62 |
1.59 |
239 |
|
Not sure |
18.29 |
1.51 |
168 |
|
Total |
100.00 |
0.00 |
1006 |
Survey responses are weighted (see Methods for details).
References
Duval, Dominic, and François Pétry. 2016. "L'analyse Automatisée Du Ton Médiatique: Construction et Utilisation de La Version Française Du Lexicoder Sentiment Dictionary." Canadian Journal of Political Science/Revue canadienne de science politique 49 (2).
Hainmueller, Jens, Daniel J. Hopkins, and Teppei Yamamoto. 2014. "Causal Inference in Conjoint Analysis: Understanding Multidimensional Choices via Stated Preference Experiments." Political Analysis 22 (1).
King, Gary, and Langche Zeng. 2001. "Logistic Regression in Rare Events Data." Political Analysis 9 (2).
Young, Lori, and Stuart Soroka. 2012. "Affective News: The Automated Coding of Sentiment in Political Texts." Political Communication 29 (2). https://doi.org/10.1080/10584609.2012.671234.
Appendices
A Responses from survey fielded through Commission website
In addition to the three-wave panel survey presented above, which was fielded to a broadly representative sample of Canadians, we also created a short cross-sectional survey that was fielded through the Commission's website. The goal was to allow all Canadians the opportunity to provide feedback on the Commission debates.
Unlike the panel survey, this Commission-fielded survey is not intended to approximate a representative sample. Respondents could freely opt in. By design, no demographic information was collected.
With the exception of one question pertaining to organized debate viewing events, the Commission-fielded survey consisted of a subset of questions that appeared in Waves 2 and 3 of the three-wave panel survey.
The Commission-fielded survey was available to Canadians between October 7 and November 12. We received a total of 457 complete responses. Although the survey was made available in both English and French, the vast majority of respondents (97%) completed the survey in English.
The results for each question are reported below.
A.1 Debate viewership
|
|
Percent |
N |
|---|---|---|
|
Did not watch |
3.28 |
15 |
|
Watched |
96.72 |
442 |
|
Total |
100.00 |
457 |
Survey responses are unweighted.
|
|
Percent |
N |
|---|---|---|
|
Did not watch |
54.08 |
126 |
|
Watched |
45.92 |
107 |
|
Total |
100.00 |
233 |
Question administered to respondents who completed the survey after the start of French debate. Survey responses are unweighted.
A.2 Viewership medium
Table 84: How Watched English Debate (Responses from survey administered through
Commission website)
|
|
Percent |
N |
|---|---|---|
|
TV |
55.20 |
244 |
|
Radio |
2.94 |
13 |
|
Online |
41.86 |
185 |
|
Total |
100.00 |
442 |
Question administered to debate watchers only. Survey responses are unweighted.
Table 85: How Watched French Debate (Responses from survey administered through
Commission website)
|
|
Percent |
N |
|---|---|---|
|
TV |
50.47 |
54 |
|
Online |
49.53 |
53 |
|
Total |
100.00 |
107 |
Question administered to debate watchers only. Survey responses are unweighted.
A.3 Viewed with others
|
|
Percent |
N |
|---|---|---|
|
Alone |
49.32 |
218 |
|
With Others |
50.68 |
224 |
|
Total |
100.00 |
442 |
Question administered to debate watchers only. Survey responses are unweighted.
|
|
Percent |
N |
|---|---|---|
|
Alone |
65.42 |
70 |
|
With Others |
34.58 |
37 |
|
Total |
100.00 |
107 |
Question administered to debate watchers only. Survey responses are unweighted.
|
|
Percent |
N |
|---|---|---|
|
Not part of organized event |
89.29 |
200 |
|
Part of organized event |
10.71 |
24 |
|
Total |
100.00 |
224 |
Question administered to respondents who watched with others. Survey responses are unweighted.
|
|
Percent |
N |
|---|---|---|
|
Not part of organized event |
89.19 |
33 |
|
Part of organized event |
10.81 |
4 |
|
Total |
100.00 |
37 |
Question administered to respondents who watched with others. Survey responses are unweighted.
|
|
Percent |
N |
|---|---|---|
|
Me personally |
25.00 |
6 |
|
Friends |
8.33 |
2 |
|
Family |
8.33 |
2 |
|
Co-workers |
4.17 |
1 |
|
A political party |
4.17 |
1 |
|
Other |
37.50 |
9 |
|
DK |
12.50 |
3 |
|
Total |
100.00 |
24 |
Question administered to respondents who watched as part of an organized event. Survey responses are unweighted.
|
|
Percent |
N |
|---|---|---|
|
Me personally |
25.00 |
1 |
|
Family |
50.00 |
2 |
|
Other |
25.00 |
1 |
|
Total |
100.00 |
4 |
Question administered to respondents who watched as part of an organized event. Survey responses are unweighted.
A.4 Discussed debates with others, including on social media
Table 92: Discussed what happened in the English-language leaders' debate with others
(Responses from survey administered through Commission website)
|
|
Percent |
N |
|---|---|---|
|
Yes |
91.86 |
406 |
|
No |
8.14 |
36 |
|
Total |
100.00 |
442 |
Question administered to debate watchers only. Survey responses are unweighted.
Table 93: Discussed what happened in the French-language leaders' debate with others
(Responses from survey administered through Commission website)
|
|
Percent |
N |
|---|---|---|
|
Yes |
71.03 |
76 |
|
No |
28.97 |
31 |
|
Total |
100.00 |
107 |
Question administered to debate watchers only. Survey responses are unweighted.
|
|
Percent |
N |
|---|---|---|
|
Yes |
33.94 |
150 |
|
No |
66.06 |
292 |
|
Total |
100.00 |
442 |
Question administered to debate watchers only. Survey responses are unweighted.
|
|
Percent |
N |
|---|---|---|
|
Yes |
33.64 |
36 |
|
No |
66.36 |
71 |
|
Total |
100.00 |
107 |
Question administered to debate watchers only. Survey responses are unweighted.
A.5 Reasons for not watching the debates
|
|
Percent |
N |
|---|---|---|
|
Did not know about debate |
13.33 |
2 |
|
Was not able to access |
6.67 |
1 |
|
Too busy |
13.33 |
2 |
|
Debates are not useful |
20.00 |
3 |
|
Other |
46.67 |
7 |
|
Total |
100.00 |
15 |
Question administered to respondents who did not watch the debate. Survey responses are unweighted.
|
|
Percent |
N |
|---|---|---|
|
Did not know about debate |
2.38 |
3 |
|
Did not know where to watch |
3.17 |
4 |
|
Was not able to access |
4.76 |
6 |
|
Too busy |
19.84 |
25 |
|
Already know how will vote |
10.32 |
13 |
|
Debates are not useful |
3.17 |
4 |
|
Other |
56.35 |
71 |
|
Total |
100.00 |
126 |
Question administered to respondents who did not watch the debate. Survey responses are unweighted.
A.6 Evaluation of debate content and format
|
|
Percent |
N |
|---|---|---|
|
Strongly disagree |
35.97 |
159 |
|
Somewhat disagree |
30.54 |
135 |
|
Somewhat agree |
27.83 |
123 |
|
Strongly agree |
5.43 |
24 |
|
DK |
0.23 |
1 |
|
Total |
100.00 |
442 |
Question administered to debate watchers only. Survey responses are unweighted.
|
|
Percent |
N |
|---|---|---|
|
Strongly disagree |
9.35 |
10 |
|
Somewhat disagree |
14.02 |
15 |
|
Somewhat agree |
52.34 |
56 |
|
Strongly agree |
21.50 |
23 |
|
DK |
2.80 |
3 |
|
Total |
100.00 |
107 |
Question administered to debate watchers only. Survey responses are unweighted.
|
|
Percent |
N |
|---|---|---|
|
Strongly disagree |
11.76 |
52 |
|
Somewhat disagree |
33.71 |
149 |
|
Somewhat agree |
28.51 |
126 |
|
Strongly agree |
22.85 |
101 |
|
DK |
3.17 |
14 |
|
Total |
100.00 |
442 |
Question administered to debate watchers only. Survey responses are unweighted.
|
|
Percent |
N |
|---|---|---|
|
Strongly disagree |
28.97 |
31 |
|
Somewhat disagree |
41.12 |
44 |
|
Somewhat agree |
16.82 |
18 |
|
Strongly agree |
9.35 |
10 |
|
DK |
3.74 |
4 |
|
Total |
100.00 |
107 |
Question administered to debate watchers only. Survey responses are unweighted.
|
|
Percent |
N |
|---|---|---|
|
Strongly disagree |
2.04 |
9 |
|
Somewhat disagree |
14.48 |
64 |
|
Somewhat agree |
38.24 |
169 |
|
Strongly agree |
42.08 |
186 |
|
DK |
3.17 |
14 |
|
Total |
100.00 |
442 |
Question administered to debate watchers only. Survey responses are unweighted.
|
|
Percent |
N |
|---|---|---|
|
Strongly disagree |
13.08 |
14 |
|
Somewhat disagree |
43.93 |
47 |
|
Somewhat agree |
27.10 |
29 |
|
Strongly agree |
10.28 |
11 |
|
DK |
5.61 |
6 |
|
Total |
100.00 |
107 |
Question administered to debate watchers only. Survey responses are unweighted.
|
|
Percent |
N |
|---|---|---|
|
Strongly disagree |
41.40 |
183 |
|
Somewhat disagree |
31.45 |
139 |
|
Somewhat agree |
22.40 |
99 |
|
Strongly agree |
4.52 |
20 |
|
DK |
0.23 |
1 |
|
Total |
100.00 |
442 |
Question administered to debate watchers only. Survey responses are unweighted.
|
|
Percent |
N |
|---|---|---|
|
Strongly disagree |
12.15 |
13 |
|
Somewhat disagree |
15.89 |
17 |
|
Somewhat agree |
54.21 |
58 |
|
Strongly agree |
14.95 |
16 |
|
DK |
2.80 |
3 |
|
Total |
100.00 |
107 |
Question administered to debate watchers only. Survey responses are unweighted.
|
|
Percent |
N |
|---|---|---|
|
Strongly disagree |
25.34 |
112 |
|
Somewhat disagree |
25.57 |
113 |
|
Somewhat agree |
36.88 |
163 |
|
Strongly agree |
11.99 |
53 |
|
DK |
0.23 |
1 |
|
Total |
100.00 |
442 |
Question administered to debate watchers only. Survey responses are unweighted.
|
|
Percent |
N |
|---|---|---|
|
Strongly disagree |
7.48 |
8 |
|
Somewhat disagree |
16.82 |
18 |
|
Somewhat agree |
50.47 |
54 |
|
Strongly agree |
20.56 |
22 |
|
DK |
4.67 |
5 |
|
Total |
100.00 |
107 |
Question administered to debate watchers only. Survey responses are unweighted.
|
|
Percent |
N |
|---|---|---|
|
Strongly disagree |
4.07 |
18 |
|
Somewhat disagree |
21.72 |
96 |
|
Somewhat agree |
30.77 |
136 |
|
Strongly agree |
42.31 |
187 |
|
DK |
1.13 |
5 |
|
Total |
100.00 |
442 |
Question administered to debate watchers only. Survey responses are unweighted.
|
|
Percent |
N |
|---|---|---|
|
Strongly disagree |
10.28 |
11 |
|
Somewhat disagree |
33.64 |
36 |
|
Somewhat agree |
27.10 |
29 |
|
Strongly agree |
25.23 |
27 |
|
DK |
3.74 |
4 |
|
Total |
100.00 |
107 |
Question administered to debate watchers only. Survey responses are unweighted.
|
|
Percent |
N |
|---|---|---|
|
Strongly disagree |
16.74 |
74 |
|
Somewhat disagree |
13.12 |
58 |
|
Somewhat agree |
20.59 |
91 |
|
Strongly agree |
48.42 |
214 |
|
DK |
1.13 |
5 |
|
Total |
100.00 |
442 |
Question administered to debate watchers only. Survey responses are unweighted.
|
|
Percent |
N |
|---|---|---|
|
Strongly disagree |
22.43 |
24 |
|
Somewhat disagree |
14.95 |
16 |
|
Somewhat agree |
27.10 |
29 |
|
Strongly agree |
31.78 |
34 |
|
DK |
3.74 |
4 |
|
Total |
100.00 |
107 |
Question administered to debate watchers only. Survey responses are unweighted.
A.6.1 Evaluations of the debate moderators
|
|
Percent |
N |
|---|---|---|
|
Strongly disagree |
24.66 |
109 |
|
Somewhat disagree |
15.16 |
67 |
|
Somewhat agree |
31.22 |
138 |
|
Strongly agree |
24.43 |
108 |
|
DK |
4.52 |
20 |
|
Total |
100.00 |
442 |
Question administered to debate watchers only. Survey responses are unweighted.
|
|
Percent |
N |
|---|---|---|
|
Strongly disagree |
9.35 |
10 |
|
Somewhat disagree |
6.54 |
7 |
|
Somewhat agree |
40.19 |
43 |
|
Strongly agree |
37.38 |
40 |
|
DK |
6.54 |
7 |
|
Total |
100.00 |
107 |
Question administered to debate watchers only. Survey responses are unweighted.
|
|
Percent |
N |
|---|---|---|
|
Strongly disagree |
28.05 |
124 |
|
Somewhat disagree |
22.17 |
98 |
|
Somewhat agree |
34.16 |
151 |
|
Strongly agree |
14.03 |
62 |
|
DK |
1.58 |
7 |
|
Total |
100.00 |
442 |
Question administered to debate watchers only. Survey responses are unweighted.
|
|
Percent |
N |
|---|---|---|
|
Strongly disagree |
8.41 |
9 |
|
Somewhat disagree |
7.48 |
8 |
|
Somewhat agree |
43.93 |
47 |
|
Strongly agree |
36.45 |
39 |
|
DK |
3.74 |
4 |
|
Total |
100.00 |
107 |
Question administered to debate watchers only. Survey responses are unweighted.
|
|
Percent |
N |
|---|---|---|
|
Strongly disagree |
40.95 |
181 |
|
Somewhat disagree |
24.89 |
110 |
|
Somewhat agree |
25.57 |
113 |
|
Strongly agree |
7.01 |
31 |
|
DK |
1.58 |
7 |
|
Total |
100.00 |
442 |
Question administered to debate watchers only. Survey responses are unweighted.
|
|
Percent |
N |
|---|---|---|
|
Strongly disagree |
10.28 |
11 |
|
Somewhat disagree |
13.08 |
14 |
|
Somewhat agree |
52.34 |
56 |
|
Strongly agree |
18.69 |
20 |
|
DK |
5.61 |
6 |
|
Total |
100.00 |
107 |
Question administered to debate watchers only. Survey responses are unweighted.
|
|
Percent |
N |
|---|---|---|
|
Strongly disagree |
6.79 |
30 |
|
Somewhat disagree |
18.33 |
81 |
|
Somewhat agree |
23.30 |
103 |
|
Strongly agree |
49.55 |
219 |
|
DK |
2.04 |
9 |
|
Total |
100.00 |
442 |
Question administered to debate watchers only. Survey responses are unweighted.
|
|
Percent |
N |
|---|---|---|
|
Strongly disagree |
9.35 |
10 |
|
Somewhat disagree |
46.73 |
50 |
|
Somewhat agree |
23.36 |
25 |
|
Strongly agree |
14.02 |
15 |
|
DK |
6.54 |
7 |
|
Total |
100.00 |
107 |
Question administered to debate watchers only. Survey responses are unweighted.
|
|
Percent |
N |
|---|---|---|
|
Strongly disagree |
4.07 |
18 |
|
Somewhat disagree |
5.20 |
23 |
|
Somewhat agree |
22.62 |
100 |
|
Strongly agree |
66.74 |
295 |
|
DK |
1.36 |
6 |
|
Total |
100.00 |
442 |
Question administered to debate watchers only. Survey responses are unweighted.
|
|
Percent |
N |
|---|---|---|
|
Strongly disagree |
3.74 |
4 |
|
Somewhat disagree |
26.17 |
28 |
|
Somewhat agree |
37.38 |
40 |
|
Strongly agree |
27.10 |
29 |
|
DK |
5.61 |
6 |
|
Total |
100.00 |
107 |
Question administered to debate watchers only. Survey responses are unweighted.
|
|
Percent |
N |
|---|---|---|
|
Strongly disagree |
8.37 |
37 |
|
Somewhat disagree |
10.18 |
45 |
|
Somewhat agree |
19.23 |
85 |
|
Strongly agree |
58.60 |
259 |
|
DK |
3.62 |
16 |
|
Total |
100.00 |
442 |
Question administered to debate watchers only. Survey responses are unweighted.
|
|
Percent |
N |
|---|---|---|
|
Strongly disagree |
12.15 |
13 |
|
Somewhat disagree |
21.50 |
23 |
|
Somewhat agree |
37.38 |
40 |
|
Strongly agree |
24.30 |
26 |
|
DK |
4.67 |
5 |
|
Total |
100.00 |
107 |
Question administered to debate watchers only. Survey responses are unweighted.
A.6.2 Evaluations of the party leaders
|
|
Percent |
N |
|---|---|---|
|
Strongly disagree |
32.81 |
145 |
|
Somewhat disagree |
42.08 |
186 |
|
Somewhat agree |
21.49 |
95 |
|
Strongly agree |
2.94 |
13 |
|
DK |
0.68 |
3 |
|
Total |
100.00 |
442 |
Question administered to debate watchers only. Survey responses are unweighted.
|
|
Percent |
N |
|---|---|---|
|
Strongly disagree |
11.21 |
12 |
|
Somewhat disagree |
22.43 |
24 |
|
Somewhat agree |
57.01 |
61 |
|
Strongly agree |
3.74 |
4 |
|
DK |
5.61 |
6 |
|
Total |
100.00 |
107 |
Question administered to debate watchers only. Survey responses are unweighted.
|
|
Percent |
N |
|---|---|---|
|
Strongly disagree |
31.67 |
140 |
|
Somewhat disagree |
34.16 |
151 |
|
Somewhat agree |
30.32 |
134 |
|
Strongly agree |
2.71 |
12 |
|
DK |
1.13 |
5 |
|
Total |
100.00 |
442 |
Question administered to debate watchers only. Survey responses are unweighted.
|
|
Percent |
N |
|---|---|---|
|
Strongly disagree |
14.02 |
15 |
|
Somewhat disagree |
21.50 |
23 |
|
Somewhat agree |
49.53 |
53 |
|
Strongly agree |
8.41 |
9 |
|
DK |
6.54 |
7 |
|
Total |
100.00 |
107 |
Question administered to debate watchers only. Survey responses are unweighted.
|
|
Percent |
N |
|---|---|---|
|
Strongly disagree |
0.90 |
4 |
|
Somewhat disagree |
6.11 |
27 |
|
Somewhat agree |
23.98 |
106 |
|
Strongly agree |
68.55 |
303 |
|
DK |
0.45 |
2 |
|
Total |
100.00 |
442 |
Question administered to debate watchers only. Survey responses are unweighted.
|
|
Percent |
N |
|---|---|---|
|
Strongly disagree |
7.48 |
8 |
|
Somewhat disagree |
37.38 |
40 |
|
Somewhat agree |
31.78 |
34 |
|
Strongly agree |
16.82 |
18 |
|
DK |
6.54 |
7 |
|
Total |
100.00 |
107 |
Question administered to debate watchers only. Survey responses are unweighted.
|
|
Percent |
N |
|---|---|---|
|
Strongly disagree |
2.71 |
12 |
|
Somewhat disagree |
11.99 |
53 |
|
Somewhat agree |
45.02 |
199 |
|
Strongly agree |
38.69 |
171 |
|
DK |
1.58 |
7 |
|
Total |
100.00 |
442 |
Question administered to debate watchers only. Survey responses are unweighted.
|
|
Percent |
N |
|---|---|---|
|
Strongly disagree |
2.80 |
3 |
|
Somewhat disagree |
16.82 |
18 |
|
Somewhat agree |
49.53 |
53 |
|
Strongly agree |
23.36 |
25 |
|
DK |
7.48 |
8 |
|
Total |
100.00 |
107 |
Question administered to debate watchers only. Survey responses are unweighted.
|
|
Percent |
N |
|---|---|---|
|
Strongly disagree |
0.45 |
2 |
|
Somewhat disagree |
6.56 |
29 |
|
Somewhat agree |
37.10 |
164 |
|
Strongly agree |
53.85 |
238 |
|
DK |
2.04 |
9 |
|
Total |
100.00 |
442 |
Question administered to debate watchers only. Survey responses are unweighted.
|
|
Percent |
N |
|---|---|---|
|
Somewhat disagree |
12.15 |
13 |
|
Somewhat agree |
57.01 |
61 |
|
Strongly agree |
22.43 |
24 |
|
DK |
8.41 |
9 |
|
Total |
100.00 |
107 |
Question administered to debate watchers only. Survey responses are unweighted.
A.7 How to select which leaders to invite to participate in debates
|
|
Mean Rank |
|---|---|
|
Number of ridings with candidates |
2.51 |
|
Number of MPs |
2.63 |
|
Support in polls |
2.76 |
|
Size of membership |
3.28 |
|
Judgments of debate organizers |
4.72 |
|
Number of donors |
5.11 |
|
Observations |
457 |
Survey responses are unweighted.
A.8 Requirement for broadcasters to carry debates
|
|
Percent |
N |
|---|---|---|
|
Yes |
70.46 |
322 |
|
No |
15.75 |
72 |
|
Not sure |
13.79 |
63 |
|
Total |
100.00 |
457 |
Survey responses are unweighted.